Technical Analysis and TradingView Indicators

Technical analysis – statistical representations of historical market data – can help traders make decisions more quickly in high-speed markets like forex, where increased leverage relative to stocks can shift profits and losses greatly in a short amount of time. Access to technical analysis tools, often called indicators, can aid you in the decision-making process when paired with a foundational understanding.
TradingView offers advanced charting capabilities and other strategic resources for multiple asset classes – including stocks and forex – all in an easy-to-use platform.* After learning how to get started with TradingView, you can explore forex to see if this unique asset is worth adding to your portfolio.
Picking the Right Technical Analysis for You
Picking the right technical analysis tools is a personal process that often includes some trial and error. After learning about some of the most popular indicators below and linking your account to TradingView, you can test out the technical analysis that best fits your opinions either in a live or demo account setting.
Open a live or demo account today to start viewing forex markets
How to Access TradingView Indicators
TradingView’s technical analysis tools can be found in the “Indicators” section of the platform on the top bar when viewing your charts. After clicking “Indicators,” a pop-up menu will present all the technical analysis TradingView has to offer.
Historical EUR/USD Prices with Indicators (Daily Closes over Last Year)
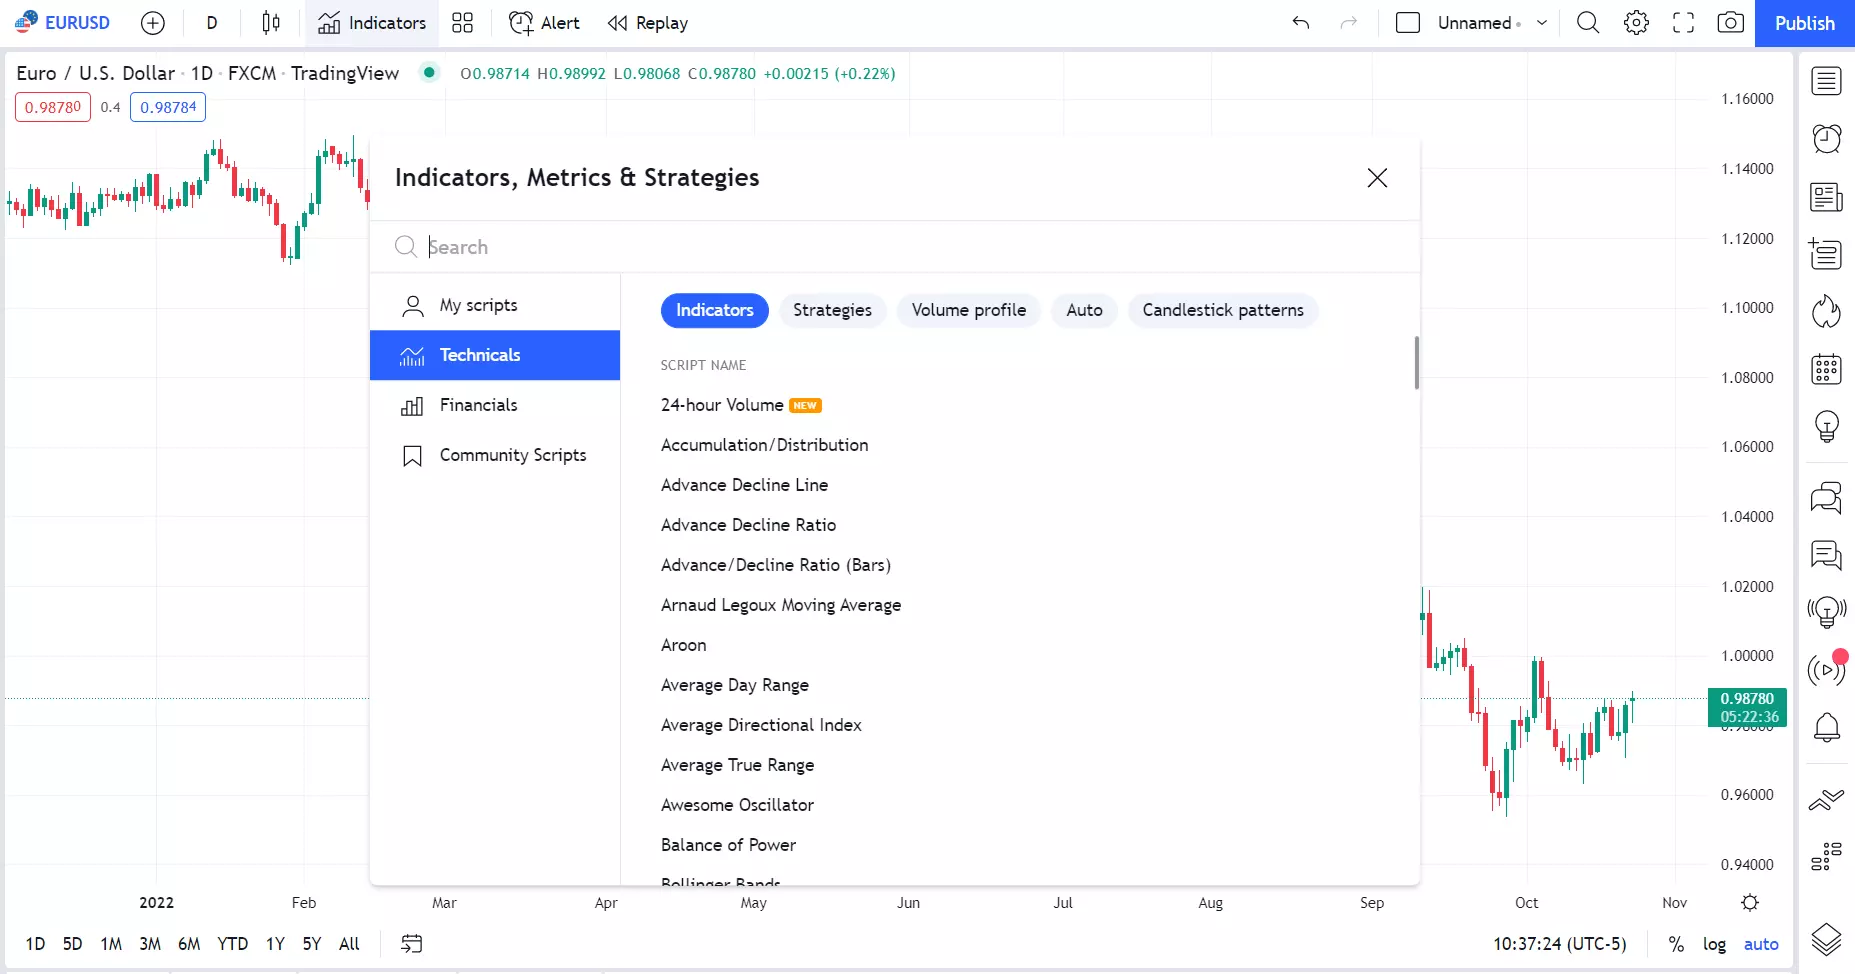
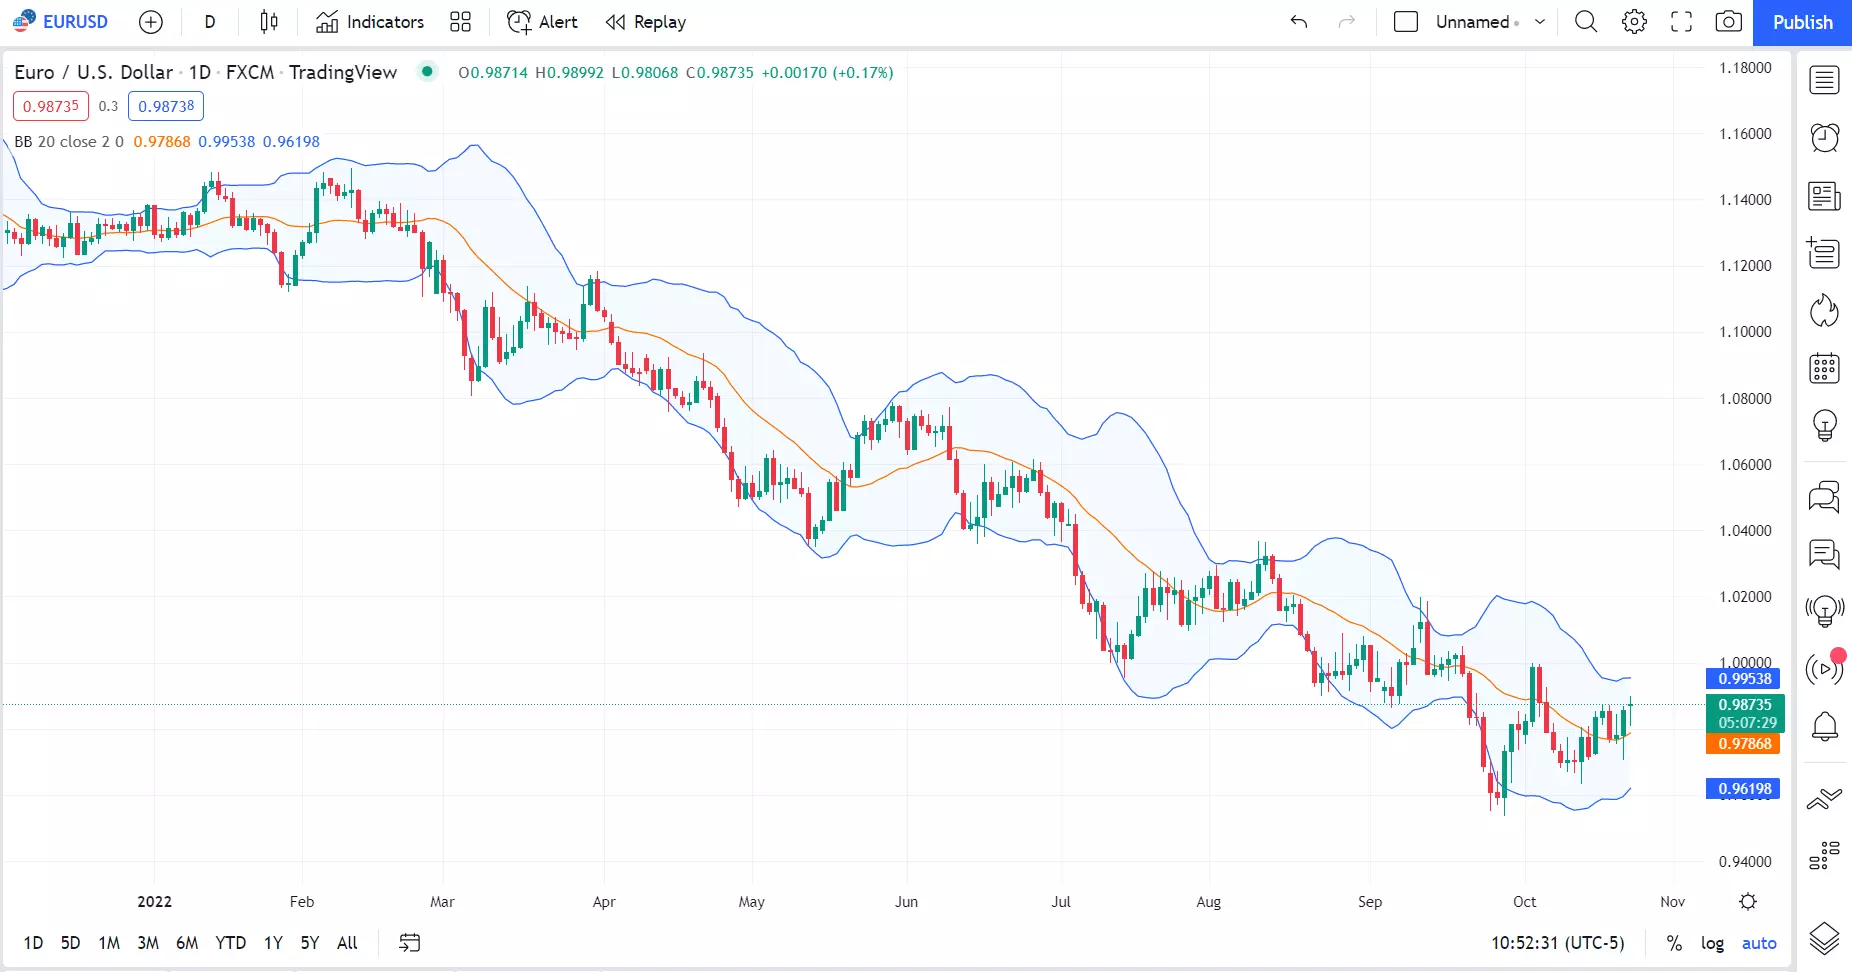
Clicking on one of the indicators will cause the corresponding data to populate the chart. For example, choosing the Bollinger Bands indicator will add three lines to your chart – a moving average in the middle of two standard deviation boundaries.
Historical EUR/USD Prices with Bollinger Bands (Daily Closes over Last Year)
Best TradingView Indicators to Use
The best indicators are those that fit your trading style – how you formulate an opinion of a given market – and help you to make decisions on where to enter or exit positions more efficiently and effectively. Some of the most popular indicators can be a good place to start when looking for the best ones for you.
Moving Average (MA) and Moving Average Convergence Divergence (MACD)
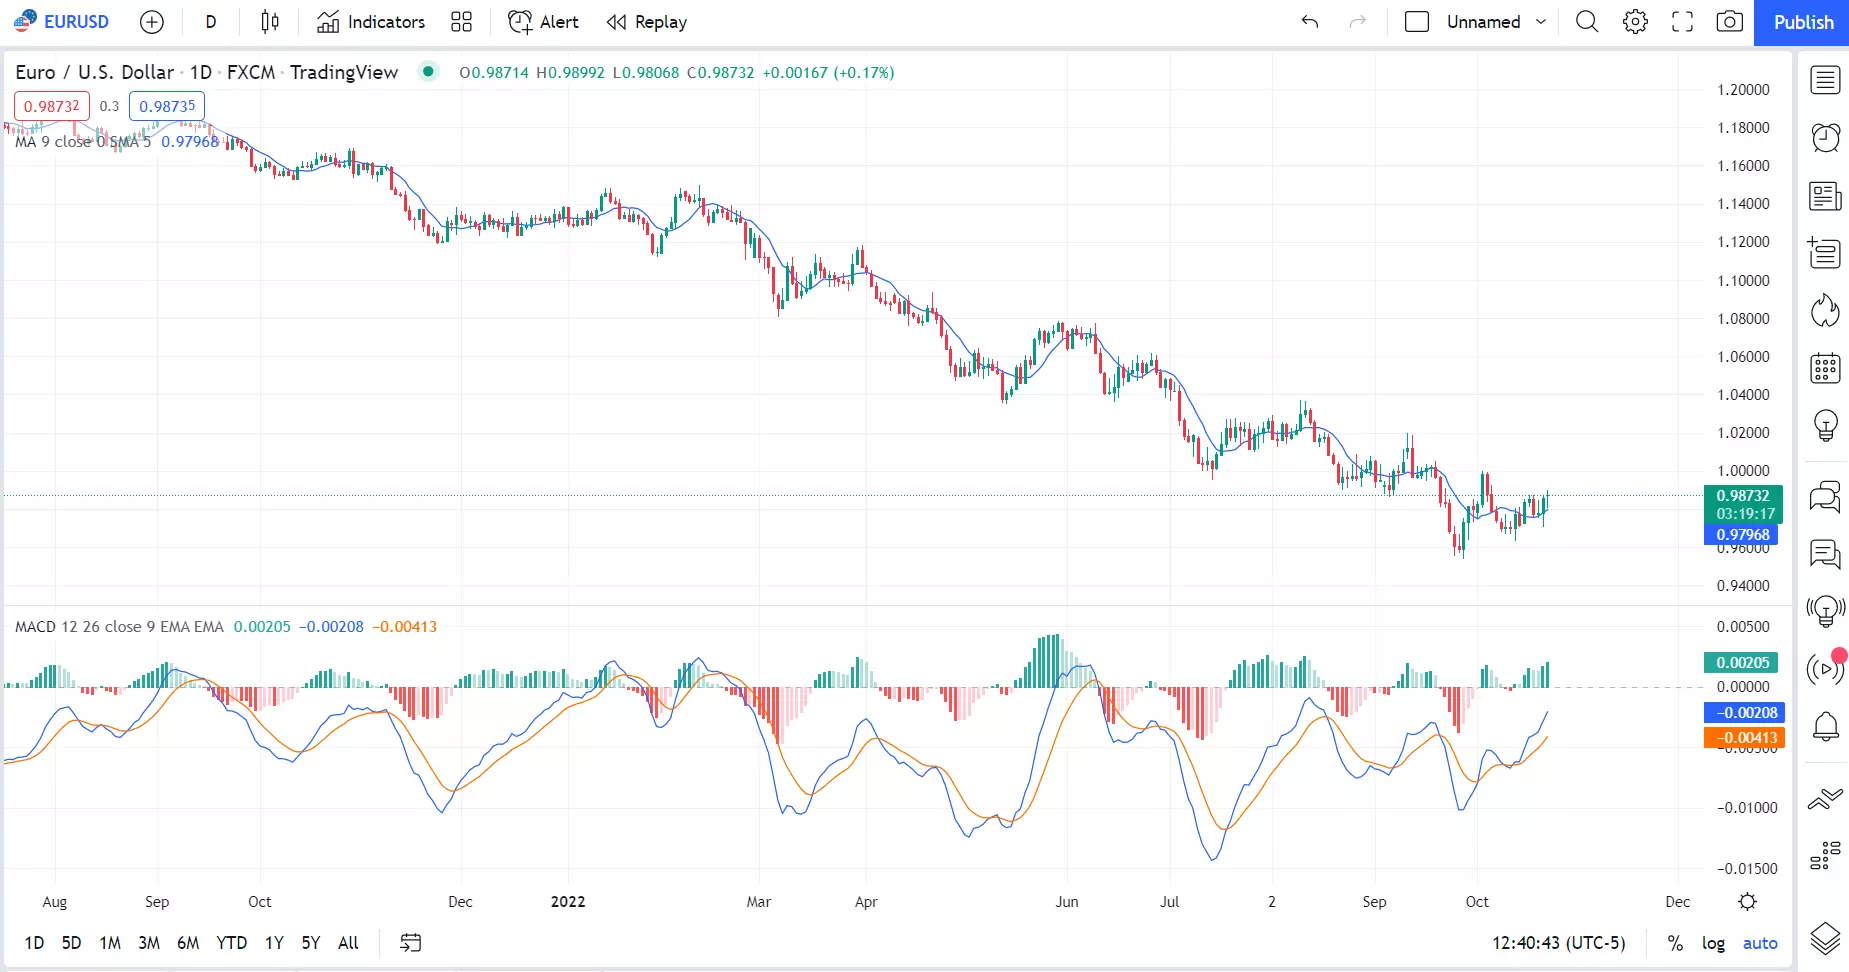
The Moving Average (MA) – pictured below as the blue line laid over the actual chart – creates an average price over a specified period of time such as the last 9 days. Many traders use MAs to smooth out the “noise” of day-to-day trading activity and make trading assumptions based on whether the current price is above or below the MA. For example, a contrarian thinker might sell a market whose current price is trading higher than the MA.
The Moving Average Convergence Divergence (MACD) incorporates a MACD line and a Signal line – pictured below in the blue and orange lines, respectively, laid underneath the chart – as well as a histogram – also pictured underneath the chart. The MACD line subtracts a longer-term MA from a shorter-term one resulting in a positive or negative value that can show upward momentum in the market when positive and downward momentum when negative. The Signal line is a MA of the MACD data for the last specified amount of days, and, when the MACD line crosses the Signal line, it can portray potential momentum in the direction the MACD crossed. Finally, the histogram simply shows the difference between the MACD and Signal lines at any point in time.
Historical EUR/USD Prices with Moving Averages (Daily Closes over Last Year)
Relative Strength Index (RSI)
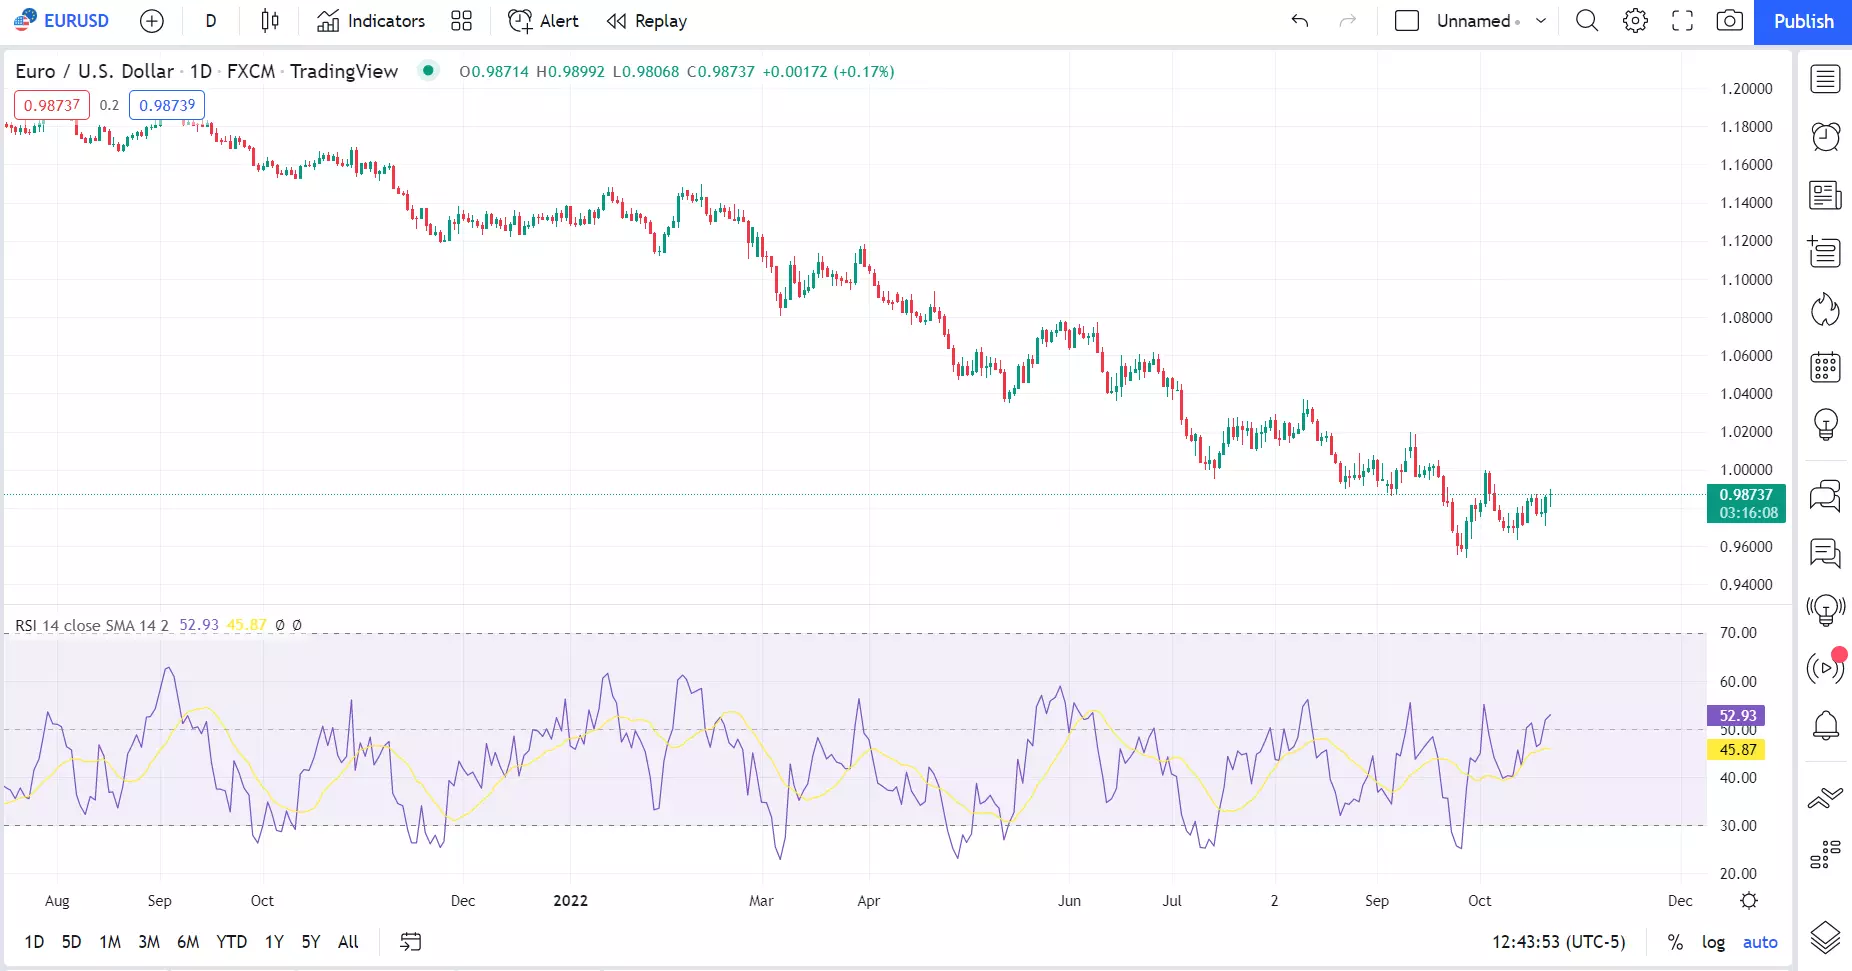
The Relative Strength Index (RSI) computes a value between 0 and 100 that can visualize the momentum of a market over a backward-looking specified timeframe such as 14 days. When RSI is near 50, it is said that the market is “neutral;” when RSI reaches 70 or above, the market is called “overbought;” and when the market falls to 30 or below, traders say the market is “oversold.”
What you do with these readings is up to you and your bias. For example, a contrarian might view a market with an “oversold” status as a potential buy thinking that the market is due for a reversal.
Historical EUR/USD Prices with Relative Strength Index (Daily Closes over Last Year)
Bollinger Bands (BB)
Bollinger Bands (BB) present a Moving Average – pictured below in orange – as well as Upper and Lower Bands – pictured below in blue – that can provide a range of where market prices might be deemed normal. When market prices escape the Upper or Lower Band – computed using standard deviation calculations – traders view these abnormal prices as having potential opportunity.
For example, a contrarian trader might view a market that has ascended above its Upper Band as a potential selling opportunity on the premise that it should return to normal prices, whereas a trend follower might attempt to buy the market and thus ride it higher to even more abnormal prices.
Historical EUR/USD Prices with Bollinger Bands (Daily Closes over Last Year)

Stochastic Oscillator
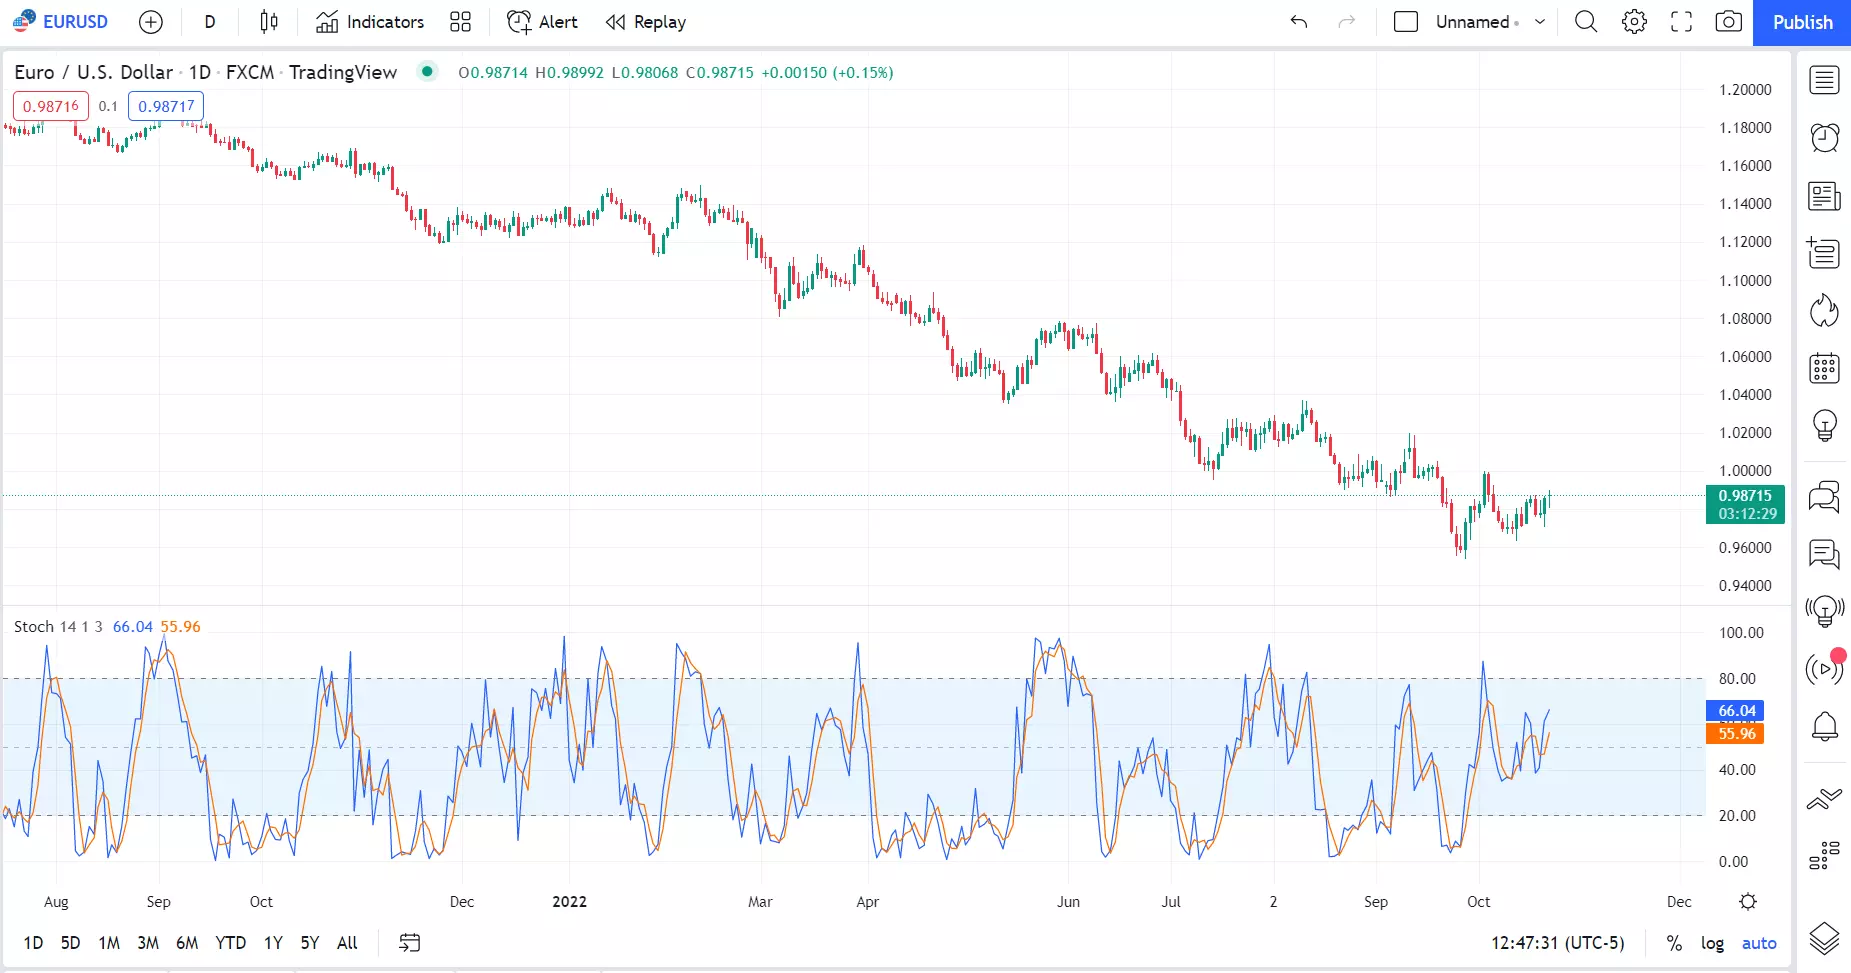
The Stochastic Oscillator incorporates a %K line – pictured below in blue – and a %D line – pictured below in orange – both of which can be valued between 0 and 100 in an effort to portray a market’s momentum. Similar to RSI, traders might classify a market as “overbought” or “oversold” if the %K line is higher than 80 or lower than 20, respectively. The %D line is simply a Moving Average of the %K data.
Like RSI, contrarian traders might buy “oversold” markets and sell “overbought” markets, while trend followers might use Stochastic Oscillators to the opposite effect.
Historical EUR/USD Prices with Stochastic Oscillator (Daily Closes over Last Year)
Charting Forex with TradingView
One of the greatest advantages to trading with technical analysis is the ability to translate your favorite indicators from one market to another. Most of these tools are not specific to an asset class, so what you’re used to using for stock or commodity trading can work similarly for forex.
After learning how to use TradingView for forex trading, you can search for the forex symbol you’d like to chart, add any technical analysis from the “Indicators” tab, and, finally, buy or sell the market all using TradingView.
*tastyfx US offers forex products. TradingView users linking to an tastyfx US account would only use said account to trade forex products.
This information has been prepared by tastyfx, a trading name of tastyfx LLC. This material does not contain a record of our trading prices, or an offer of, or solicitation for, a transaction in any financial instrument. You should not treat any opinion expressed in this material as a specific inducement to make any investment or follow any strategy, but only as an expression of opinion. This material does not consider your investment objectives, financial situation or needs and is not intended as recommendations appropriate for you. No representation or warranty is given as to the accuracy or completeness of the above information. tastyfx accepts no responsibility for any use that may be made of these comments and for any consequences that result. See our Summary Conflicts Policy, available on our website.

