The Chances of a Japanese Yen Collapse
What are the chances of a Japanese collapse? Find out.

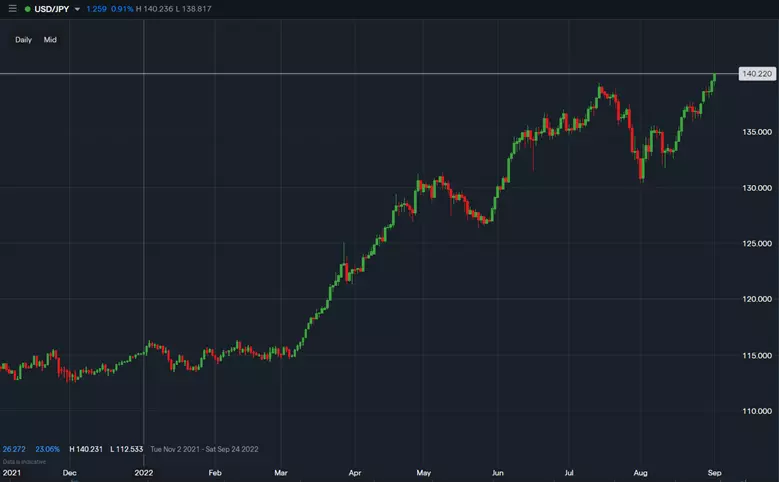
Japanese yen extended its losses against the US dollar to 20% year-to-date and 35% since the start of 2021 on Thursday, September 1, 2022, as USD/JPY reached its highest prices since August 1998.* Inflation woes continue to pair with a wide discrepancy between US and Japanese interest rates - US 10YR rates are 3.3% compared to Japan’s 0.2%† - causing flows out of JPY into USD.
Historical USD/JPY Prices (Daily 11/1/21 to 9/1/22)

How Low Can Japanese Yen Go?
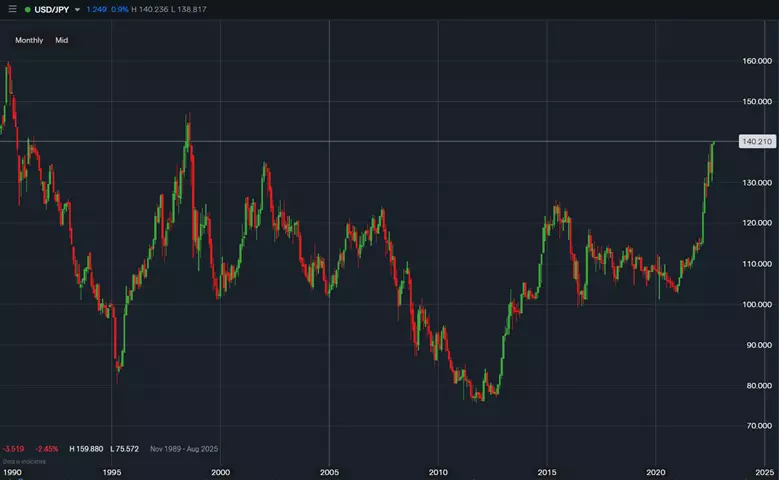
Historical USD/JPY Prices (Monthly 1/1/90 to 9/1/22)

It’s difficult to make a case for a JPY comeback story as the Bank of Japan noted that they would continue quantitative easing into the future at their July meeting,** which could further the interest rate gap between Japan and the US if the latter continues to hike rates. Not to mention the consistency with which USD/JPY has risen through these historical levels – the pair has closed 12 of the last 16 trading days higher.
On the other hand, the tides could turn if inflation readings in the US fall, as inflation has been highly correlated to projections for US interest rates. While the spread between US and Japanese rates is trending in one direction these days, no market is unidirectional into perpetuity; even a slight convergence coming from either side could be enough to knock USD/JPY from its highs.
But where will those highs take place? Whether USD/JPY is headed for a new normal or a reversion to historical averages is still unclear, but it’s hard not to have an opinion one way or the other at such a significant inflection point.
*Source: tastyfx US as of 9/1/22
†Source: Trading Economics as of 8/31/22
‡Source CME Group as of 8/31/22
**Bank of Japan Statement on Monetary Policy 6/21/22
This information has been prepared by tastyfx, a trading name of tastyfx LLC. This material does not contain a record of our trading prices, or an offer of, or solicitation for, a transaction in any financial instrument. You should not treat any opinion expressed in this material as a specific inducement to make any investment or follow any strategy, but only as an expression of opinion. This material does not consider your investment objectives, financial situation or needs and is not intended as recommendations appropriate for you. No representation or warranty is given as to the accuracy or completeness of the above information. tastyfx accepts no responsibility for any use that may be made of these comments and for any consequences that result. See our Summary Conflicts Policy, available on our website.

