What is mean reversion in trading?
Mean reversion is a concept based in statistics that assumes prices will move away from their ‘mean’ value in the short term while always returning to it in the long term. This theory cannot be confirmed given that markets are to an extent random and thus unpredictable, but there are many historical examples to confirm its relevance in asset classes like forex, interest rates, and stock volatility.*
How does mean reversion work?
After the mean is found, the day trader will look for price action away from that mean intraday for opportunities, while the swing trader and longer-term investor might aim for price extremes that could span days, weeks, or even months.
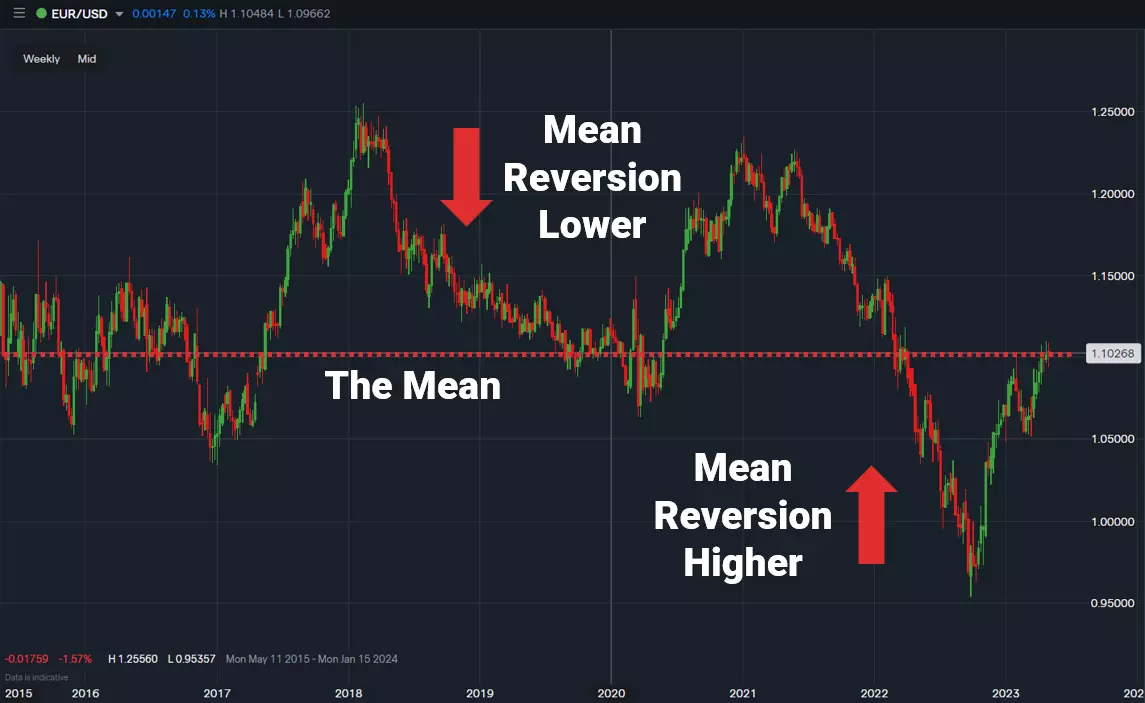
Finally, once a market is found to be moving away from its mean, traders who tend to follow trends might go in the direction of this movement while contrarians going against the grain would buy into a fall or sell into a rise suggesting a reversion to the mean.
Calculating mean reversion using a spreadsheet
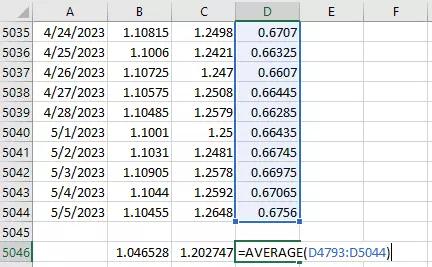
Using a simple AVERAGE() function in a spreadsheet setting like Microsoft Excel’s can determine the mean price for a given market. Traders looking for long-term extremes might factor years’ worth of data into the calculation, while those looking for shorter-term strategies might simply look at the last few weeks.
Calculating mean reversion using a trade platform
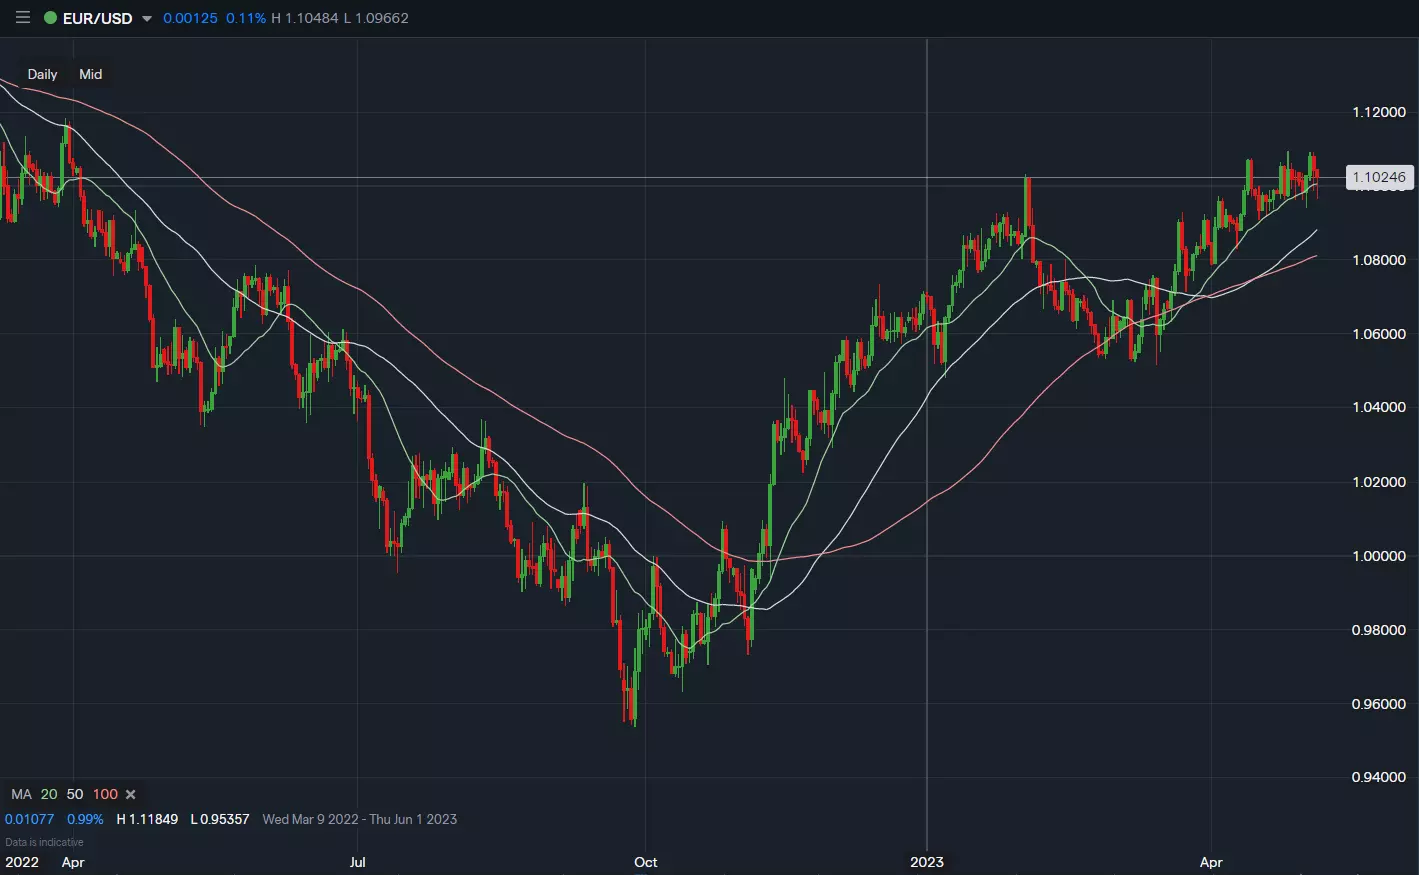
Trading platforms can offer indicators including the Moving Average, which continuously updates the average price for a market dependent on how many days are inputted. Short-term strategies like day trading and swing trading might demand 10-50 days, whereas longer-term strategies might require 100-250 days.
Check out our trading platform
Calculating mean reversion using a chart
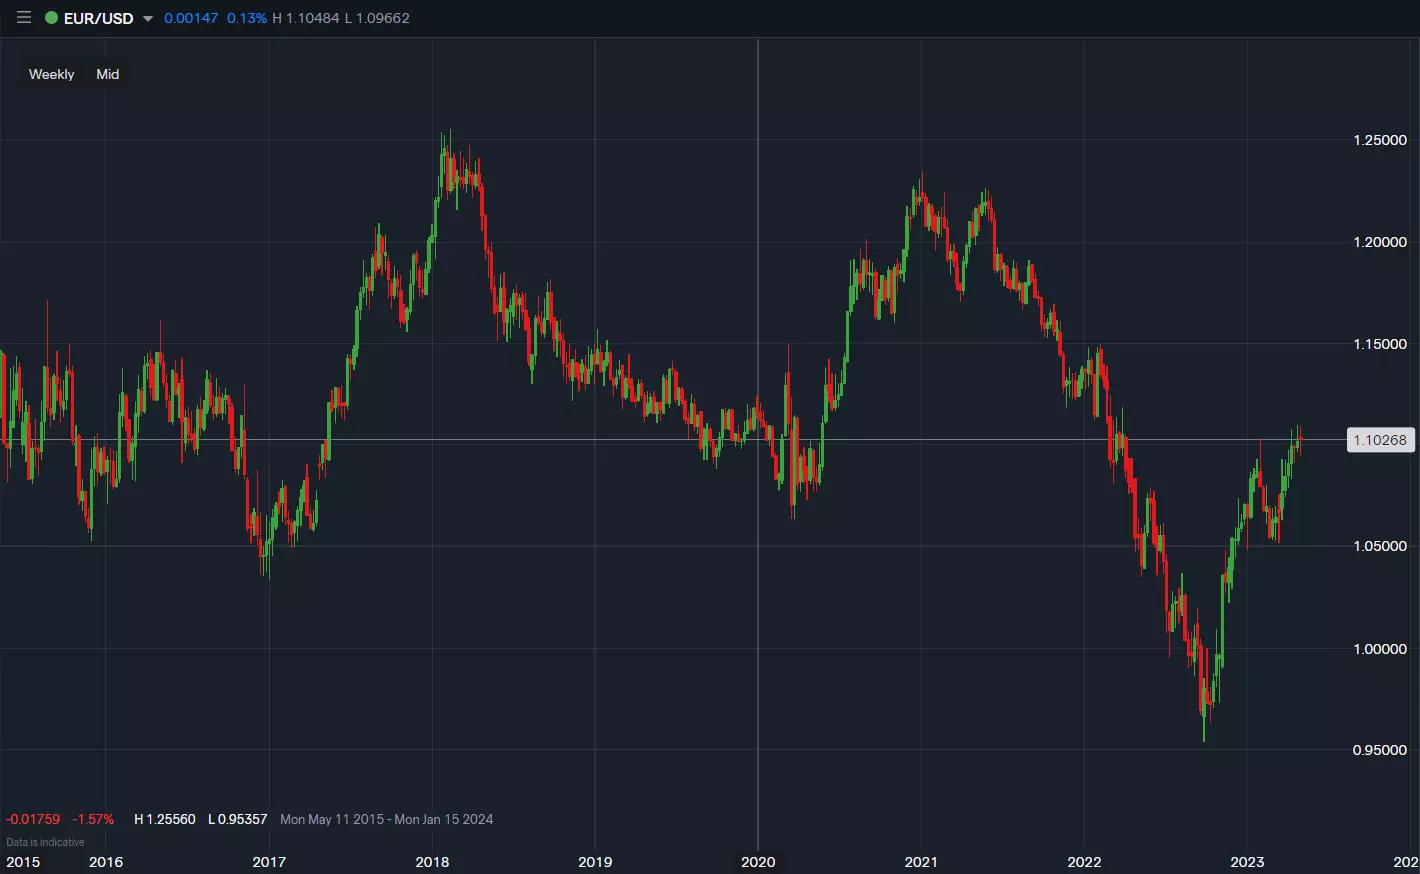
Looking at a chart can allow traders to derive a mean that’s more of a ballpark figure and less data dependent. For example, the weekly chart of EUR/USD for the last several years shows a market that’s traded around 1.1000 several times while having stretched its legs out to and beyond levels such as 1.200 and 1.0000 only to return; 1.1000 can be inferred to be a mean for such a market.
Day trading and mean reversion
Daily net change is essential to day trading using mean reversion. Many day traders will call a 0.00, or unchanged, the mean and then look for large movements away from that starting value throughout the day.
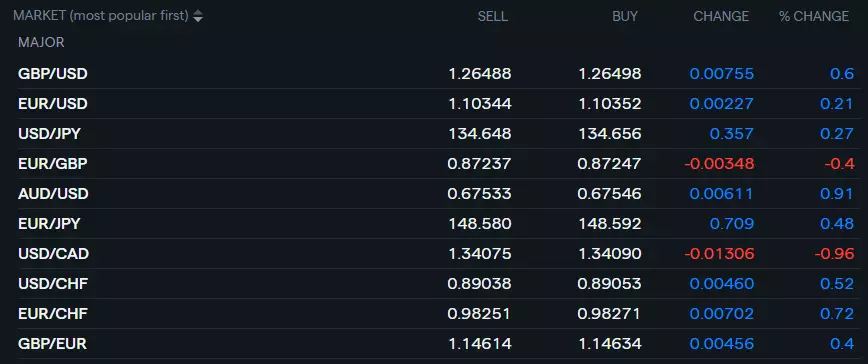
Day traders can use experience to figure what might be deemed as a ‘large’ movement purely through watching markets over time. For example, forex markets like EUR/USD and USD/JPY showing an intraday move greater than +/-1% or stock markets like the S&P 500 Index exhibiting a move more than +/-2% have traditionally been viewed as displaying ‘large’ moves.
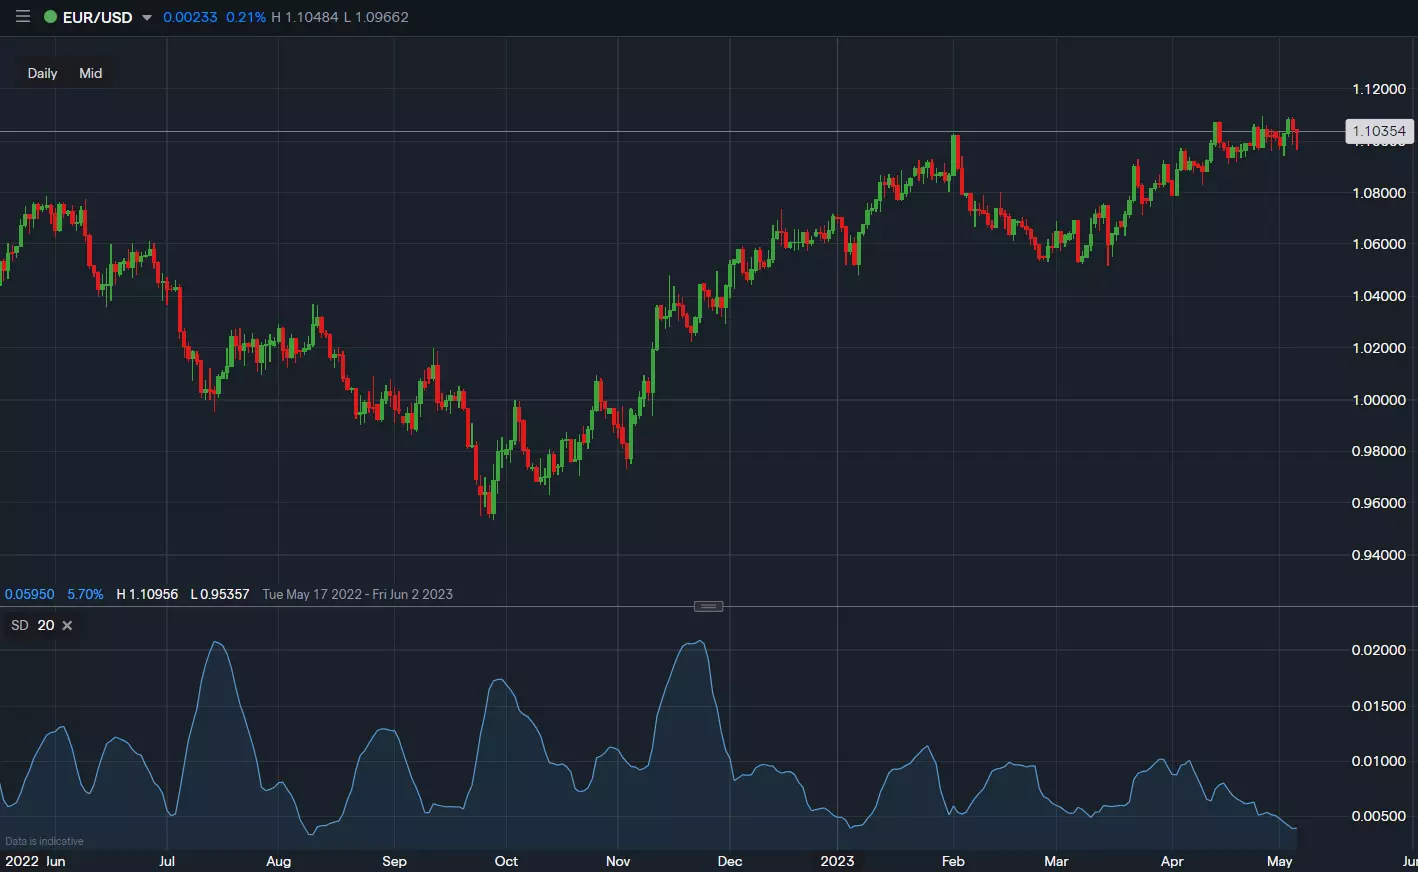
A more scientific approach might include incorporating the Standard Deviation indicator into a platform that can more dynamically adjust to periods of varying volatility.
Swing trading and mean reversion
Swing trading strategies making use of a multi-day time frame could do well to utilize Moving Averages or Bollinger Bands. The latter presents a continuously adjusting average price and standard deviation laid on top of the market’s daily chart.
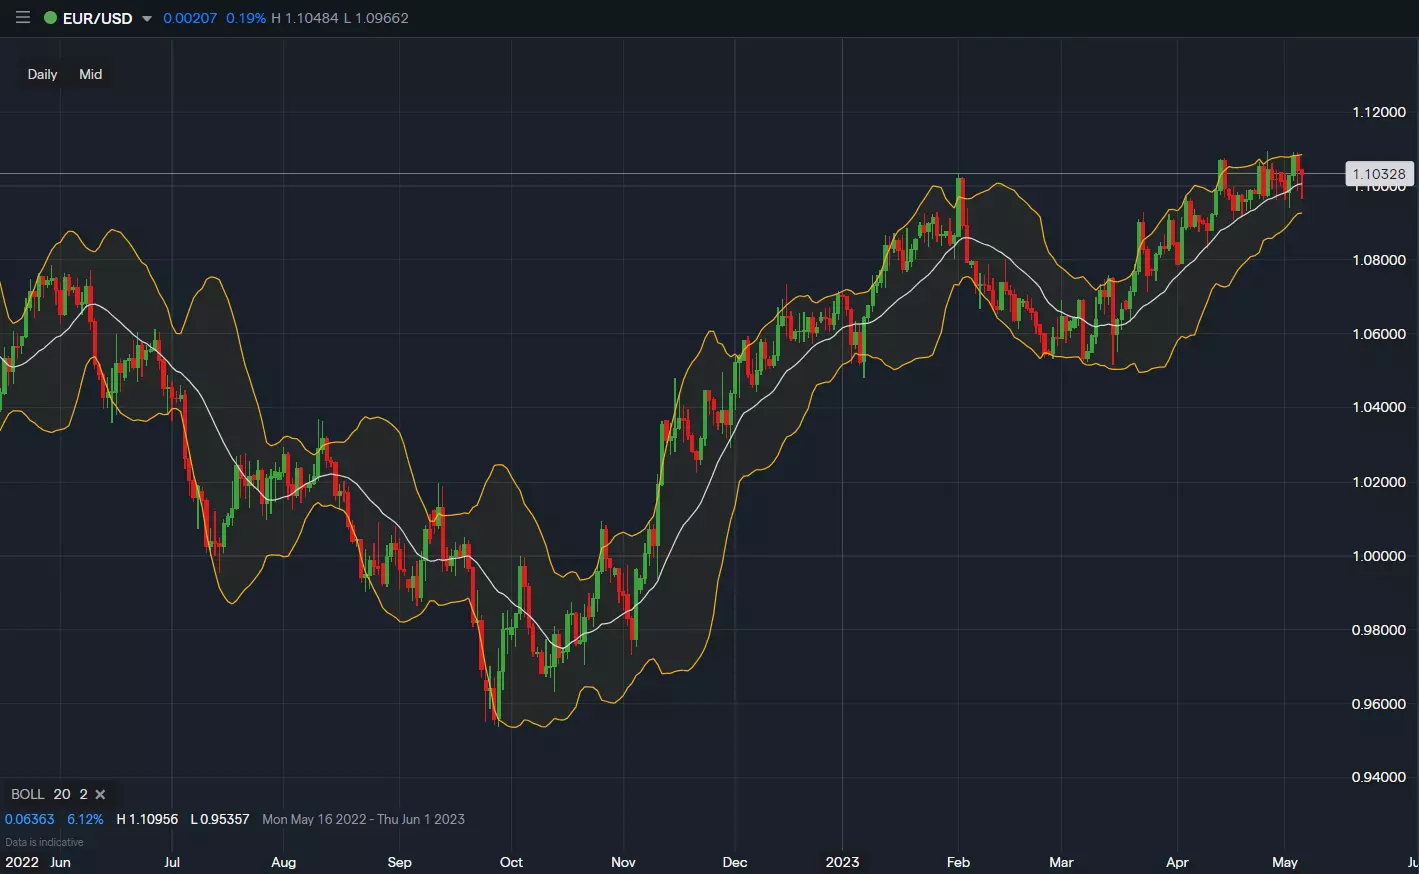
Movement outside of the bands can signal opportunity for the mean reversion trader as the market has moved significantly far away from its recent average.
Investing and mean reversion
The ability to hold positions for weeks or even months can open a trader’s opportunities up to long-term price extremes that span years. Using mean reversion to invest tends to involve finding a market trading in rare territory relative to historical prices and then going against the trend while holding until the market reverts to its mean.
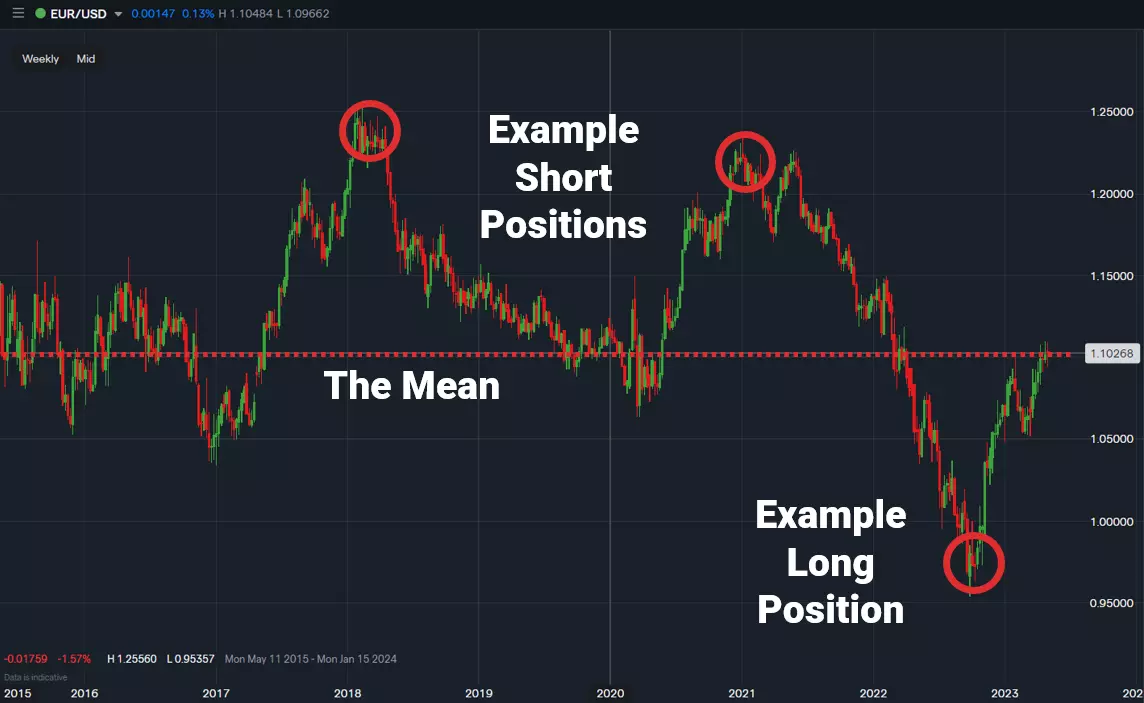
This strategy includes the risk of the market producing large short-term losses or potentially never coming back to its mean if a large economic shift occurs.
How to trade forex using mean reversion
- Choose the forex market you’d like to trade
- Open an account to get started, or practice on a demo account
- Choose your forex trading platform
- Open, monitor, and close positions
Trading forex requires an account with a forex provider like tastyfx. Many traders also watch major forex pairs like EUR/USD and USD/JPY for potential opportunities based on economic events such as inflation releases or interest rate decisions. Economic events can produce more volatility for forex pairs, which can mean greater potential profits and losses as risks can increase at these times.
You can help develop your forex trading strategies using resources like tastyfx’s YouTube channel. Once your strategy is developed, you can follow the above steps to opening an account and getting started trading forex.
Your profit or loss is calculated according to your full position size. Leverage will magnify both your profits and losses. It’s important to manage your risks carefully as losses can exceed your deposit. Ensure you understand the risks and benefits associated with trading leveraged products before you start trading with them. Trade using money you’re comfortable losing.
*tastyfx provides forex products only
This information has been prepared by tastyfx, a trading name of tastyfx LLC. This material does not contain a record of our trading prices, or an offer of, or solicitation for, a transaction in any financial instrument. You should not treat any opinion expressed in this material as a specific inducement to make any investment or follow any strategy, but only as an expression of opinion. This material does not consider your investment objectives, financial situation or needs and is not intended as recommendations appropriate for you. No representation or warranty is given as to the accuracy or completeness of the above information. tastyfx accepts no responsibility for any use that may be made of these comments and for any consequences that result. See our Summary Conflicts Policy, available on our website.

