What is the double top pattern and how to trade it?
Understand the double top pattern, a bearish reversal signal seen after two peaks. Learn how to identify, trade, and manage risks with examples and step-by-step guidance tailored for forex trading.


What is the double top pattern?
A double top pattern is a bearish reversal chart pattern that occurs after two uptrends, indicating a potential shift to a downtrend. It consists of two distinct peaks at approximately the same price level, separated by a trough or a pullback.
This candlestick pattern is somewhat reminiscent of the head and shoulders pattern, and is commonly used in various markets, including forex, stocks, commodities, and cryptocurrencies, making it a widely recognized tool for traders seeking to anticipate market reversals.
All about the double top pattern
How to identify a double top pattern
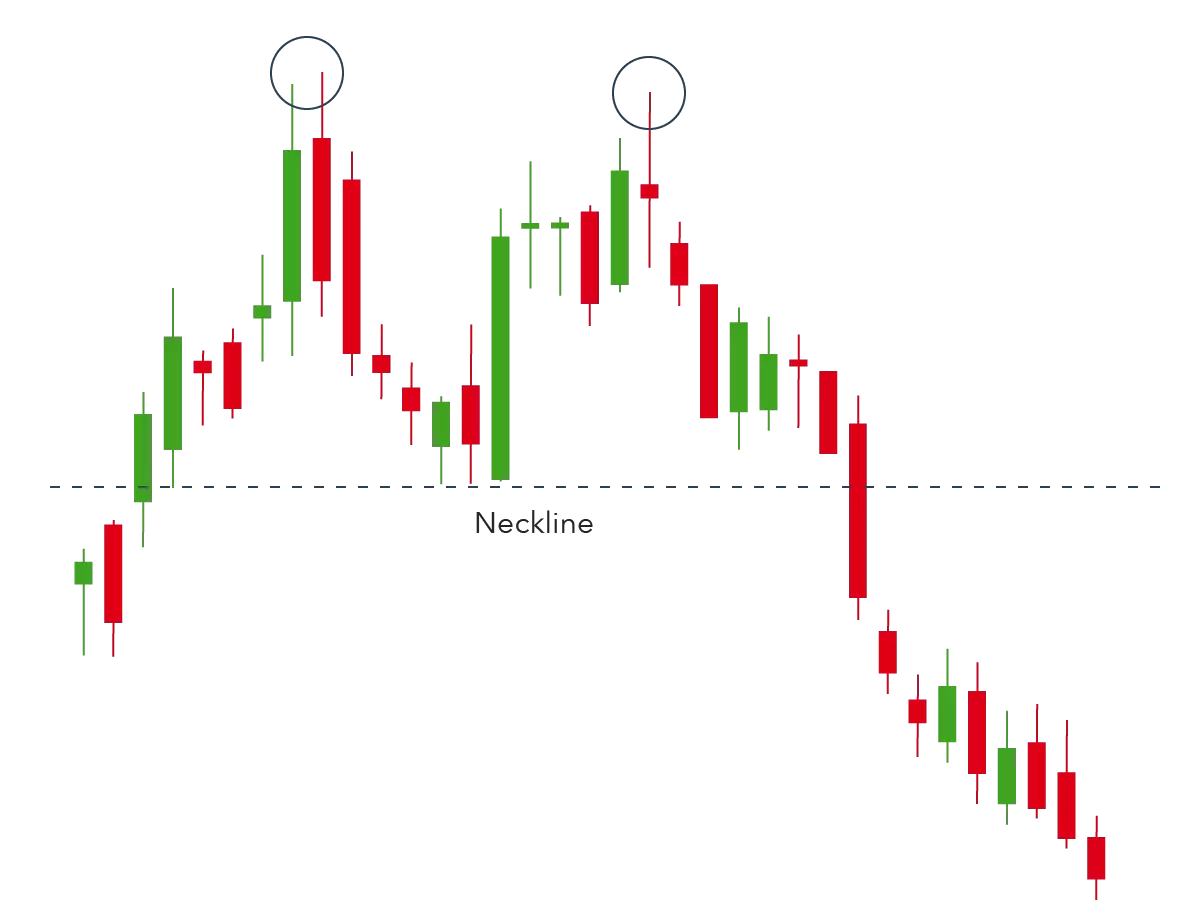
To identify a double top pattern, check out these steps, and look at the numbered chart below to follow along:
- Identify an initial bullish trend: A double top pattern typically begins with a strong bullish trend.
- First peak formation: The price reaches a new high (first peak) and then retreats down to a known support level (neckline).
- A trend downwards into a trough: The price retreats to the neckline.
- Second peak formation: The price rallies again, reaching a similar high to the first peak.
- Confirmation: The pattern is confirmed when the price retraces again and breaks below the neckline support level. This indicates a bearish reversal and suggests a sustained bearish trend.
A key point to keep in mind is that the double top pattern is only verified once the price breaks below the neckline after forming the second peak.
What does the double top pattern mean?
The double top pattern typically indicates a bearish reversal pattern, among these other potential outcomes:
Trend reversal: This is the most common significance of this pattern. The double top pattern usually forms after an extended upward trend, indicating that the bullish momentum is waning, and a bearish reversal might be imminent.
Market sentiment: This pattern can show that buyers are becoming less aggressive, and sellers are starting to gain control. The first peak represents a strong resistance level where buyers were previously overwhelmed by sellers, leading to a price retracement. The second peak reinforces this resistance as buyers fail again to push prices higher.
Confirmation of downtrend: Once the price breaks below the neckline (the support level formed between the two peaks), it confirms the pattern and suggests a potential downward trend. Traders often consider this break as a signal to enter short positions or sell their holdings.
In essence, the double top chart pattern indicates a shift in market sentiment from bullish to bearish and warns traders of a possible downward movement in price.
How to trade the double top in forex
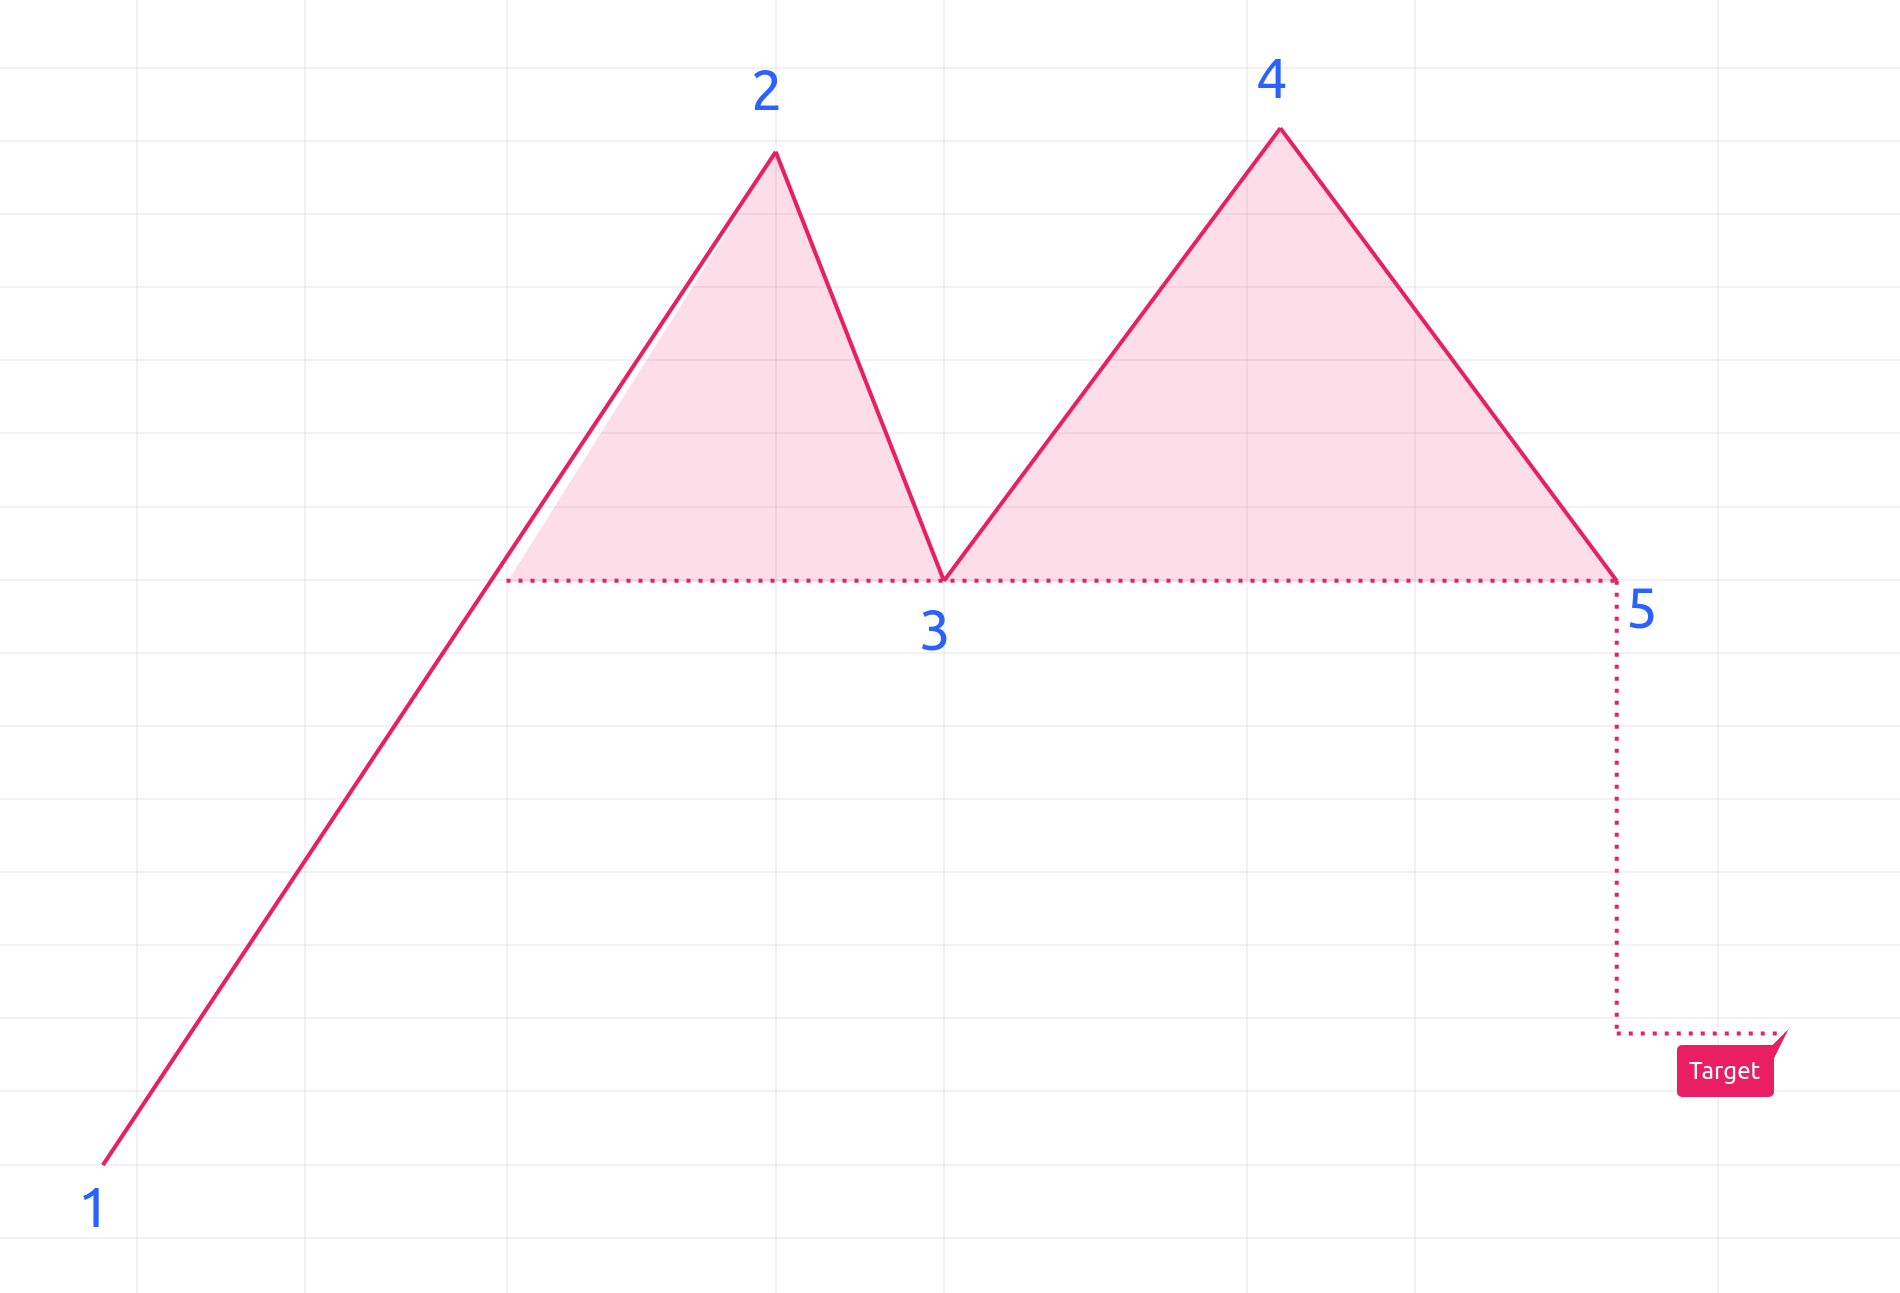
To trade double tops, follow these detailed steps:
- Identify the prevailing bullish trend: Ensure that the market is in a strong upward trend before the double top pattern forms. This sets the stage for the possible reversal.
- Spot the first peak: The price should reach a new high and then retrace to a support level known as the neckline. This first peak indicates a resistance level where the price could not move higher.
- Identify the neckline: The neckline is the support level to which the price retraces after forming the first peak. Mark this level on your chart as it will be crucial for confirming the pattern.
- Observe the second peak: The price rallies again towards the resistance level (like the first peak) but fails to break above it. This forms the second peak. The two peaks should be at approximately the same price level, though minor variations are acceptable.
- Confirm the pattern: The double top pattern is confirmed when the price breaks below the neckline after forming the second peak. This break indicates that the bullish momentum is exhausted, and a bearish reversal is likely.
- Entry point: Enter a short position (sell) when the price breaks below the neckline. This is considered the confirmation point for the double top pattern.
- Place stop loss (SL) orders: Place your stop-loss order slightly above the second peak. This helps protect against false breakouts and limits potential losses if the price reverses back up.
- Determine take profit (TP) levels: Measure the distance between the peaks and the neckline. Subtract this distance from the neckline to set your initial take profit level. This distance often serves as a reliable estimate for the anticipated price move.
- Monitor and adjust: Continuously monitor the trade and adjust your stop loss to lock in profits as the price moves in your favor. Trail your stop loss to follow the declining price, ensuring you capture more profit if the trend continues.
- Exit strategy: Exit the trade when the price reaches your take-profit level or if there are signs of a strong reversal back above the neckline.
Risk Management: For optimal risk management strategy when trading the double top pattern, utilize stop loss and take profit orders to manage risk effectively. Consider using guaranteed stops offered by some brokers to ensure your stop loss is honored even during volatile market conditions, as well as to look out for false signals. By following these steps, traders can potentially capitalize on potential bearish reversals in the forex market.
Double top forex trading example
Let's use a hypothetical example involving the EUR/USD currency pair in the forex market.
- Identify the Prevailing Bullish Trend: Over a period, the EUR/USD pair has been in a strong upward trend. The price is consistently making higher highs and higher lows.
- Spot the First Peak: The price reaches a high of 1.2000, then retraces down to 1.1800. This high at 1.2000 marks the first top, indicating a strong resistance level.
- Identify the Neckline: The support level at 1.1800 where the price retraced is the neckline. Mark this level on your chart as it will be critical for confirming the pattern.
- Observe the Second Peak: The price rallies again to approximately 1.2000 but fails to break significantly higher, forming the second top. The formation of this second peak around the same level as the first validates the resistance at 1.2000.
- Confirm the Pattern: The double top pattern is confirmed when the price breaks below the neckline at 1.1800 after forming the second peak. This indicates the bullish momentum is exhausted, and a bearish reversal is likely.
- Entry Point and Stop Loss: Once the price breaks below 1.1800, enter a short position (sell) at around 1.1780 to confirm the bearish reversal. Place a stop-loss order slightly above the second peak, for example, at 1.2020, to protect against false breakouts.
- Determine Take Profit and Monitor: Measure the distance between the peaks (1.2000) and the neckline (1.1800), which is 200 pips. Subtract this distance from the neckline to set your take profit level at 1.1600. Continuously monitor the trade and adjust your stop loss to lock in profits as the price declines. For example, if the price moves to 1.1700, you might move your stop loss to 1.1800 to ensure a breakeven if the price reverses.
- Exit Strategy: Exit the trade when the price reaches your take-profit level at 1.1600 or if it shows signs of a strong reversal back above the neckline at 1.1800.
By following these steps, you manage to capture a potential 200 pip movement, capitalizing on the bearish reversal indicated by the double top pattern. This process ensures you effectively identify, confirm, and trade the pattern while managing risk through stop-loss and take-profit orders.
Double top vs double bottom patterns: what is the difference?
The double bottom pattern forms after a downward trend and consists of two troughs at similar price levels, separated by a moderate peak. This pattern signals a potential bullish reversal, indicating strong support where the price fails to drop lower. Confirmation occurs when the price breaks above the neckline (the resistance level between the troughs), indicating an uptrend. Traders typically enter a long position upon this break, placing a stop-loss slightly below the second trough and setting the take-profit level based on the distance between the troughs and the neckline.
Key differences
| Double top | Double bottom |
|---|---|
| Indicates a bearish reversal from an uptrend. | Indicates a bullish reversal from a downtrend. |
| Features two peaks at nearly the same level. | Features two troughs at nearly the same level. |
| Confirmation occurs when the price breaks below the support level (neckline). | Confirmation occurs when the price breaks above the resistance level (neckline). |
Understanding the differences between double top and double bottom patterns helps traders identify potential market reversals and make informed trading decisions.
Key takeaways
Double Top Formation: The double top pattern forms after an extended upward trend, featuring two peaks at similar price levels, separated by a trough. It signals a potential bearish reversal when the price breaks below the neckline.
Double Bottom Formation: In contrast, the double bottom pattern forms after a downward trend, comprising two troughs at similar price levels, separated by a peak. It indicates a potential bullish reversal when the price breaks above the neckline.
Identifying and Confirming Patterns: For both patterns, confirmation occurs when the price breaks through the neckline. This break suggests a shift in market momentum—bearish for double tops and bullish for double bottoms. Traders often use other technical indicators to confirm the trend before making trading decisions.
Trading Strategy: For a double top, traders enter a short position (sell) upon confirmation, setting a stop-loss above the second peak and determining the take-profit based on the distance between the peaks and the neckline. For a double bottom, traders enter a long position (buy), setting a stop-loss below the second trough and determining the take-profit similarly. Proper risk management is crucial for maximizing potential gains and minimizing losses.
How to trade forex
- Open an account to get started, or practice on a demo account
- Choose your forex trading platform
- Open, monitor, and close positions on forex pairs
Trading forex requires an account with a forex provider like tastyfx. Many traders also watch major forex pairs like EUR/USD and USD/JPY for potential opportunities based on economic events such as inflation releases or interest rate decisions. Economic events can produce more volatility for forex pairs, which can mean greater potential profits and losses as risks can increase at these times.
You can help develop your forex trading strategies using resources like tastyfx’s YouTube channel. Our curated playlists can help you stay up to date on current markets and understanding key terms. Once your strategy is developed, you can follow the above steps to opening an account and getting started trading forex.
Your profit or loss is calculated according to your full position size. Leverage will magnify both your profits and losses. It’s important to manage your risks carefully as losses can exceed your deposit. Ensure you understand the risks and benefits associated with trading leveraged products before you start trading with them. Trade using money you’re comfortable losing.