What is the head and shoulders pattern & how to trade it
Predict trend reversals with the head and shoulders pattern; easily recognizable, it aids traders in making strategic forex decisions. Learn how to identify and trade this pattern effectively in the forex market.


What is a head and shoulders pattern?
A head and shoulders chart pattern is a popular tool in technical analysis used to predict potential trend reversals in an asset's price movement. Recognizable and easy to spot, this form of candlestick pattern helps traders make strategic decisions in the forex market. When a bearish head and shoulders pattern appears, traders often enter short positions (selling), anticipating a downward reversal. Conversely, when an inverse head and shoulders pattern is identified, traders typically enter long positions (buying), expecting an upward reversal patter.
This pattern is accessible to traders of all types and day trading experience levels due to its straightforward identification and general reliability. The head and shoulders formation provides a visual cue for traders, making it a valuable resource for those seeking to capitalize on trend changes in the forex market.
How to trade the head and shoulders pattern:
How to identify the head and shoulders pattern
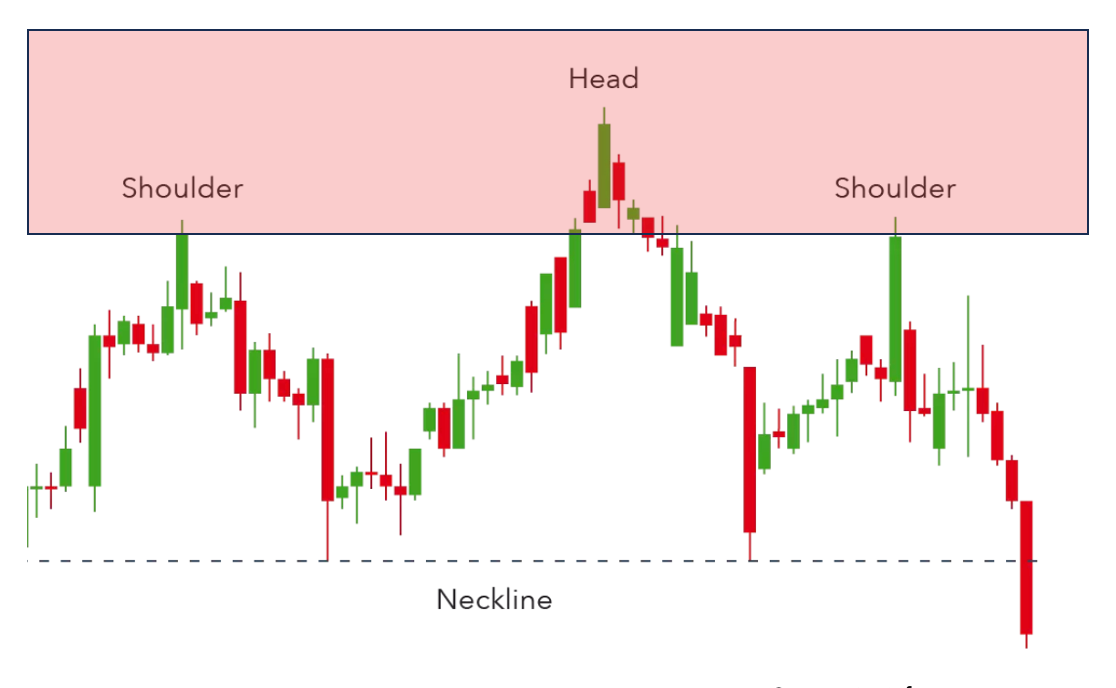
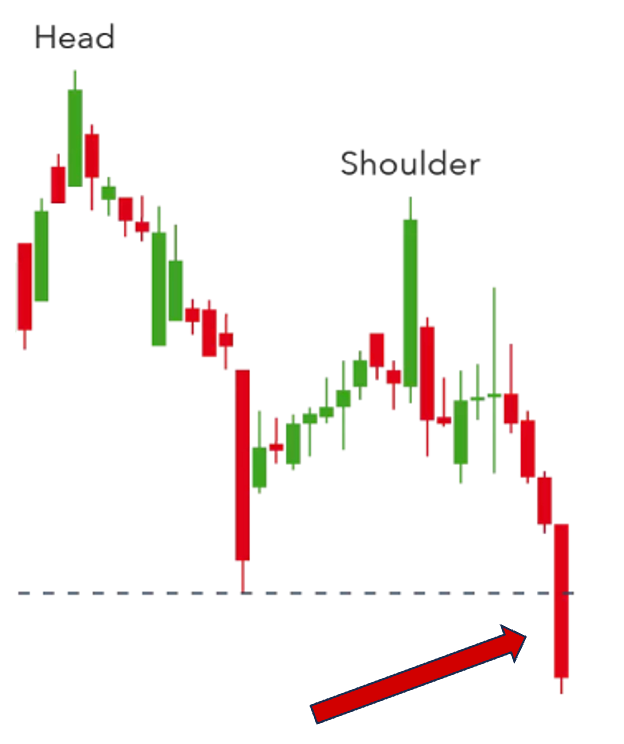
The head and shoulders pattern is made up of three distinct peaks. This pattern forms when there is one large, central peak (known as the head), with one slightly smaller peak on either side of it (the shoulders). The shoulders tend to form at similar price levels and are lower in height compared to the head.
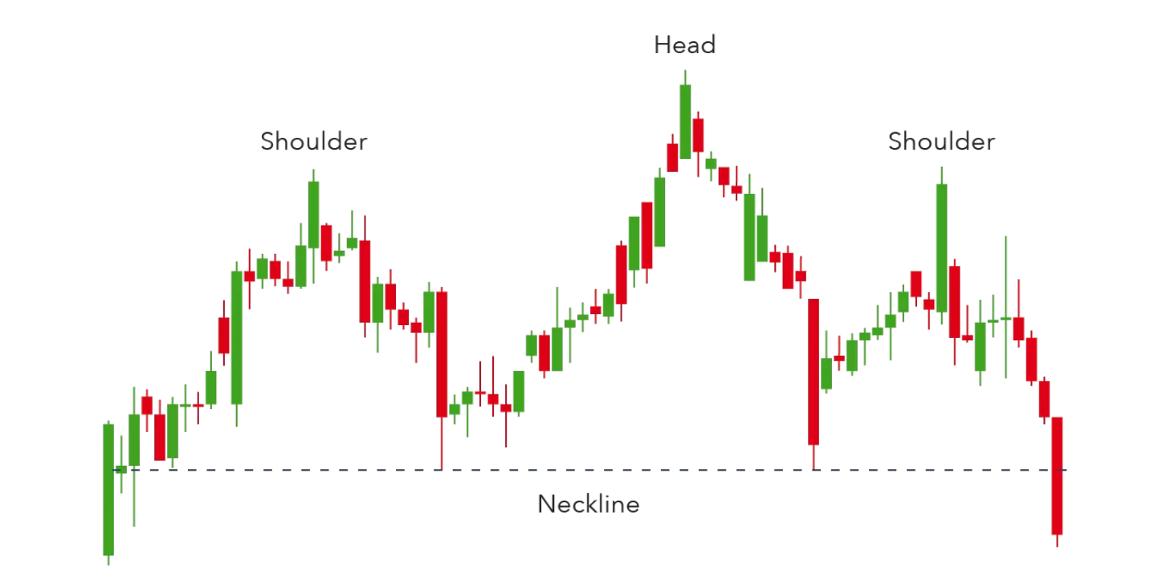
The pattern begins with the formation of the left shoulder: prices rise to a peak and then decline. Following this, the price ascends to an even higher peak, forming the head, before declining once again. Finally, the price rises one last time to create a peak similar in size to the first one, forming the right shoulder.
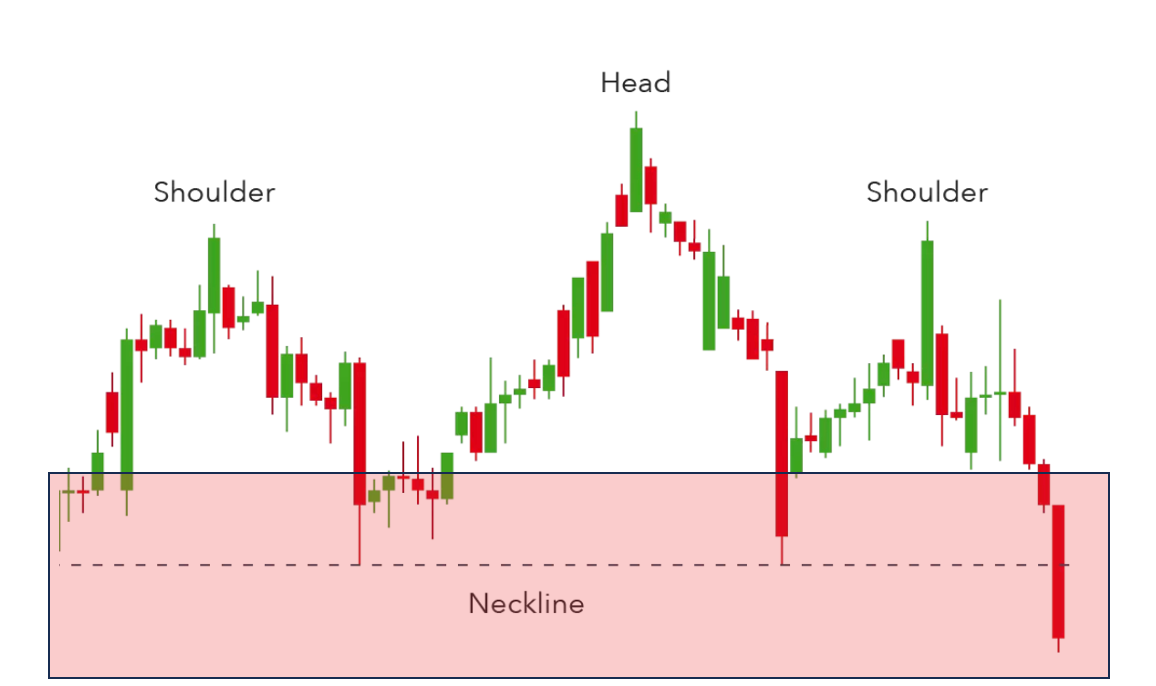
The neckline, a key element of this pattern, is drawn by connecting the lowest points of the two troughs (the dips between the head and shoulders). If the price breaks below the neckline after forming the right shoulder, it signals a potential bearish reversal pattern, indicating the end of the previous uptrend.
How to trade the head and shoulders pattern in forex
Trading the head and shoulders pattern in forex involves a series of steps designed to identify the pattern, confirm the trend reversal, and establish strategic entry and exit points. Here are the steps to effectively trade the head and shoulders pattern:
1. Identify the trend
Before the pattern even forms, it is important to identify that the asset is in an uptrend. That way, there is a potential reversal to a downtrend, and so on.
2. Identify the first shoulder, the head, and the second shoulder
First, identify a peak followed by a decline; this should align with the previous uptrend but should not be the highest point—this forms the first shoulder. Next, observe a rise in the price after the decline from the first shoulder. This should form a higher peak and then decline again, forming the head. Lastly, look for another rise that creates a peak similar in height to the first shoulder; this constitutes the second shoulder.
3. Draw the neckline to confirm the pattern
Connect the lowest points of the two troughs following each shoulder. This forms the neckline, which is essential for confirming the pattern.
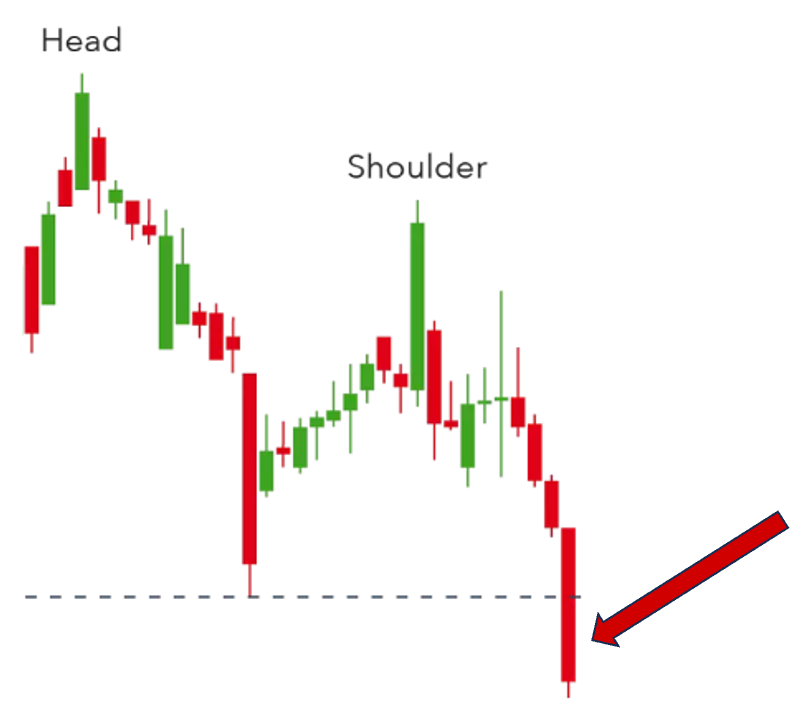
4. Confirm the break
Wait until the price breaks below the neckline after the right shoulder forms. When this happens, bearish reversal is probable. Trading volume plays a crucial role here – high trading volume as the price breaks below the neckline indicates the pattern’s reliability.
5. Entry point
This is where the action starts. Once the price breaks below the neckline, enter a short position (sell).
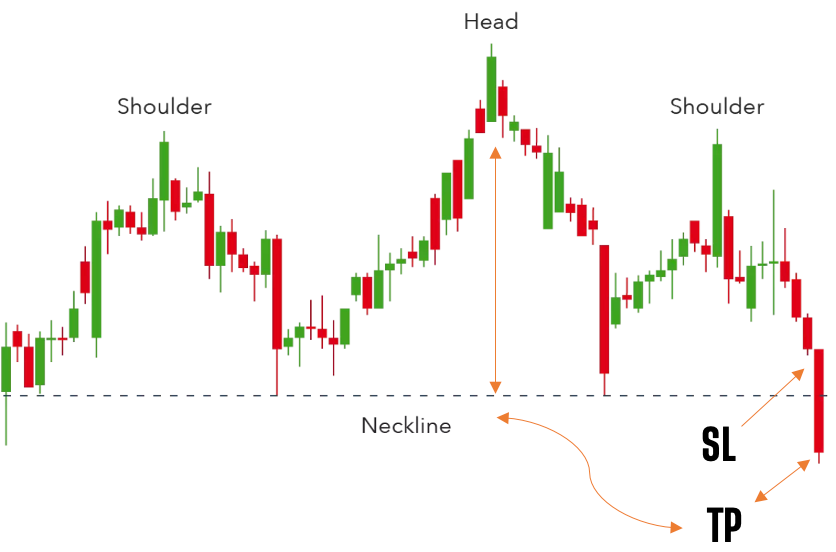
6. Find your stop loss and take profit placement
As for stop loss, place it above the right shoulder or slightly above the neckline. This will protect against false breakouts, and limit potential losses if the pattern does not play out as expected. For take profit, measure the distance from the highest point of the head all the way to the neckline, projecting it downward from the neckline break point. This gives you the price target for your take profit order.
7. Confirm the trend reversal
Be sure to monitor the price action and volume to ensure that the trend is indeed reversing. A sustained move below the neckline with increasing volume provides stronger confirmation of the reversal pattern.
8. Exit strategy
Finally, if the price reaches your take profit level, exit the trade to secure profits. Furthermore, consider exiting the trade if the price action shows signs of reversing back above the neckline, or if market conditions abruptly change.

By following these steps, traders can effectively trade the head and shoulders pattern in forex, making informed decisions based on the pattern's indications and market behavior.
Trading head and shoulders: example
Examples are the easiest way to learn just about any pattern. Here is an example of a bearish trend within this pattern. It is important to remember that no pattern is “perfect,” and exact numbers like these are rarely seen!
Example of EUR/USD Bearish Head and Shoulders
Trend: EUR/USD is in an uptrend, creating higher highs.
Identify First Shoulder: The price rises to a peak at 1.2100 and then declines to 1.2000.
Head: The price then rises to a higher peak at 1.2200 and declines again to 1.2000.
Second Shoulder: The price rises again to 1.2100 (similar height to the first shoulder) and then declines.
Neckline: Draw a line connecting the two lows at 1.2000.
Confirm the Break: The price breaks below the neckline at 1.2000 with increased volume, confirming a bearish reversal.
Entry Point: Enter a short position (sell) at 1.1950 after a slight retest of the neckline.
Stop Loss: Place a stop loss at 1.2050, slightly above the right shoulder.
Take Profit: Measure the distance from the head (1.2200) to the neckline (1.2000), which is 200 pips. Project this distance down from the neckline break point (1.1950 - 200 pips = 1.1750). Set the take profit at 1.1750.
Inverse head and shoulders pattern
An inverse head and shoulders pattern is a chart formation used to predict a potential bullish reversal in the trend of a financial asset, including forex currency pairs. This inverse pattern is essentially the opposite of the traditional head and shoulders pattern and is characterized by three troughs (or lows), with the middle trough being the lowest (the head) and the two outer troughs (the shoulders) being higher and roughly equal in height.
Components of an inverse head and shoulders pattern:
- Left Shoulder: The price declines to a trough and then rises.
- Head: The price declines further to a lower trough and then rises again.
- Right Shoulder: The price declines once more to a trough that is similar in height to the left shoulder and then rises again.
- Neckline: A line drawn connecting the highest points of the two rallies (peaks) between the head and the shoulders. This line can be horizontal or slightly sloped.
Example:
Left Shoulder: The price declines to 50, then rises to 55.
Head: The price declines further to 45, then rises to 55.
Right Shoulder: The price declines to 50, then rises again.
Neckline: Drawn at 55 by connecting the two peaks between the shoulders and the head.
Confirmation: The price breaks above 55 with increased volume.
Entry Point: Buy at 56 after the breakout.
Stop Loss: Place at 49, below the right shoulder.
Take Profit: Measure the distance from the head (45) to the neckline (55), which is 10 units. Project this distance upward from the neckline break point (56 + 10 = 66). Set the take profit at 66.
The inverse head and shoulders pattern is a reliable indicator for identifying potential bullish reversals and is widely used by traders to make informed decisions about entering long positions.
Head and shoulders pattern key takeaways
The head and shoulders pattern is a powerful tool for anticipating trend reversals, signaling shifts from an uptrend to a downtrend (bearish) or from a downtrend to an uptrend (bullish). This formation consists of three peaks: a higher central peak (head) and two smaller, similar-height peaks (shoulders), connected by a neckline. Confirmation of the pattern occurs when the price decisively breaks the neckline, especially with increased trading volume, indicating market conviction. Traders can strategically enter trades post-break, set stop losses near the shoulders for protection, and calculate take profit targets by projecting the distance from the head to the neckline. This pattern is applicable across various markets, including forex, stocks, commodities, and cryptocurrencies, making it a versatile and accessible tool for traders of all experience levels. Embracing this straightforward and reliable pattern enhances trading strategies and optimizes opportunities across different financial assets.
How to trade forex
- Open an account to get started, or practice on a demo account
- Choose your forex trading platform
- Open, monitor, and close positions on forex pairs
Trading forex requires an account with a forex provider like tastyfx. Many traders also watch major forex pairs like EUR/USD and USD/JPY for potential opportunities based on economic events such as inflation releases or interest rate decisions. Economic events can produce more volatility for forex pairs, which can mean greater potential profits and losses as risks can increase at these times.
You can help develop your forex trading strategies using resources like tastyfx’s YouTube channel. Our curated playlists can help you stay up to date on current markets and understand key terms. Once your strategy is developed, you can follow the above steps to opening an account and getting started trading forex.
Your profit or loss is calculated according to your full position size. Leverage will magnify both your profits and losses. It’s important to manage your risks carefully as losses can exceed your deposit. Ensure you understand the risks and benefits associated with trading leveraged products before you start trading with them. Trade using money you’re comfortable losing.