What’s the difference between technical and fundamental analysis?

Technical and fundamental analyses aim to output trading opportunities from historical price data and economic reports, respectively. While some may subscribe to one exclusively, both forms of analysis can be helpful in strategizing around any market.
What is technical analysis?
Technical analysis makes trading strategies out of a market’s price data by using statistical modeling to find patterns. These tools are often overlaid atop charts in the form of indicators found on your trading platform.
Examples of technical analysis
There are hundreds of examples of technical analysis tools ranging from industry standards like the Moving Average to more bespoke indicators invoking a person’s name. tastyfx offers several of the most popular indicators in their charting package, and the following are some examples.
Moving Average
The Moving Average (MA) presents the average value of the last n (inputted) data points from the closing values of those n candles in the time interval. Traders might use a Moving Average to compare the recent trade to the current price in an effort to derive whether or not the market will trade above or below the MA in the future.
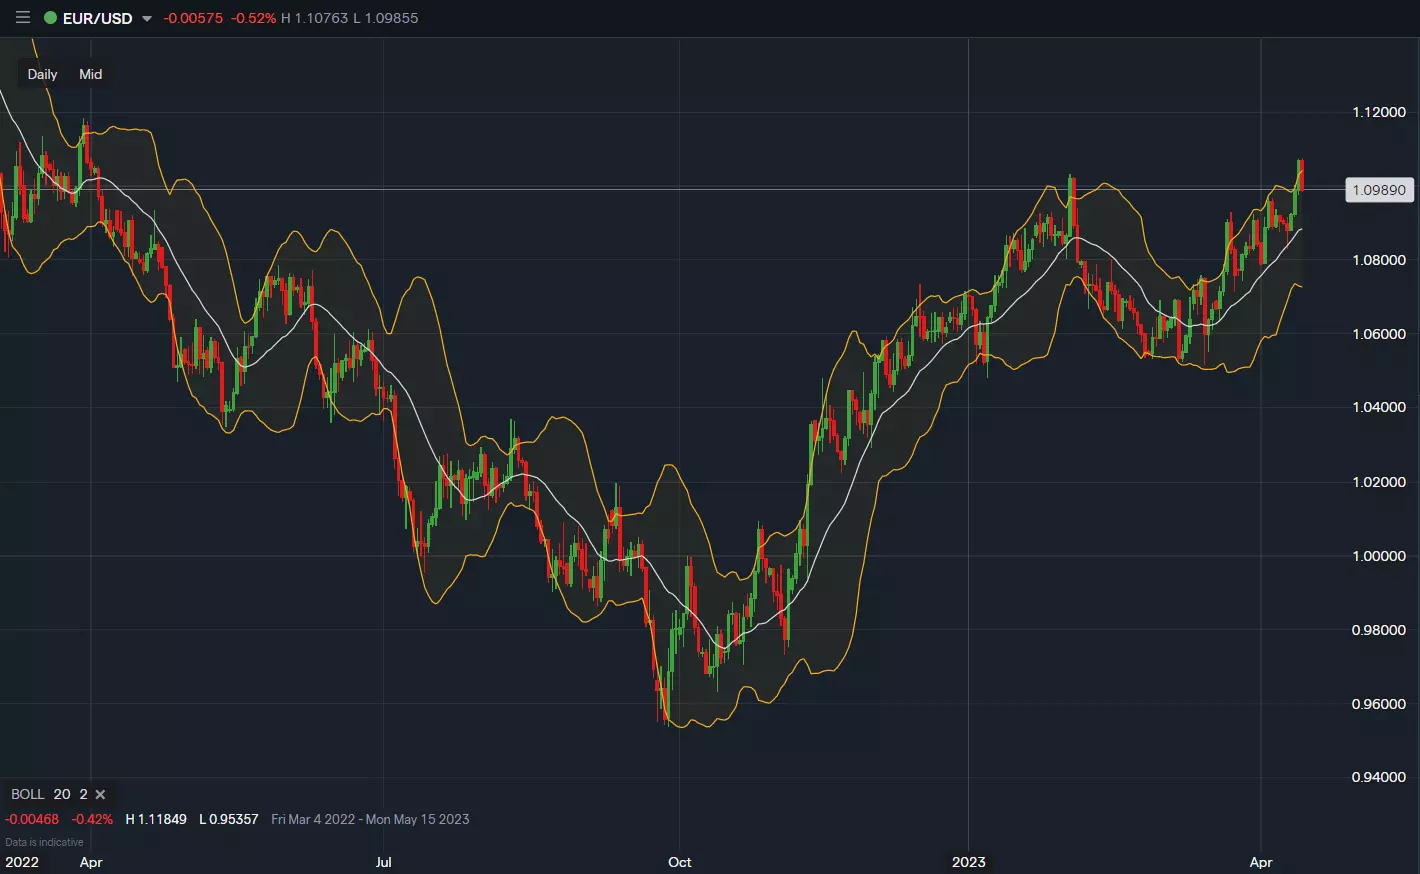
Bollinger Bands
Bollinger Bands integrate the Moving Average indicator and standard deviation calculations to present a range that the market projects to trade within 68.3% according to mathematical theory. Traders can use Bollinger Bands to measure the current market against its projected bounds for the given time interval; this can determine inside price action versus an outside, or outlier, day.
Relative Strength Index
The Relative Strength Index (RSI) attempts to convey how “oversold” or “overbought” a market is by outputting a value from 0 to 100 from historical prices; values near 0, usually 30 and under, convey the former opinion of the market while values closer to 100, 70 and up, fall in the latter column. Traders tend to take an oversold reading, 0 to 30, as a bullish indicator, and they might take an overbought reading, 70 to 100, as a bearish one.
What is fundamental analysis?
Fundamental analysis makes trading strategies out of a market’s economic data by comparing incoming economic reports to past and expected values. These measures are often found in economic calendars and news feeds.
Economies all over the world are changing every hour affecting how major markets might move. You can use calendars and news to stay up to date on everything from employment to inflation.
Practice trading the next major economic event on a demo account
Examples of fundamental analysis
Several economic events occur daily shifting prices for assets as they come out. tastyfx allows you to curate your schedule by country and impact level using their economic calendars; the following are some exemplary data points.
Interest rates
Most major economies have a central bank that sets the region’s benchmark interest rate at regular intervals throughout the year. Increases to this rate can be a sign of economic strength, while interest rate cuts can come at times of economic weakness. Traders will often use an interest rate environment to form opinions of the economies performance and how it might relate to other economies.
This can be especially relevant in forex markets whose prices tend to shift on this basis of economic relativity.
Inflation rates, or Consumer Price Index
Inflation rates, often measured using the Consumer Price Index (CPI) of a currency’s purchasing power relative to a basket of goods and services, are usually announced monthly. Many central banks aim for inflation rates between 2-3% cutting interest rates while inflation is under the level and hiking when over it.
Gross Domestic Product
Gross Domestic Product (GDP) measures the overarching value of goods and services purchased in a given period of time that were produced in a region. GDP gives a synopsis of how well or poorly an economy is performing; high GDP numbers can translate to positive sentiment for the region’s assets, while low values can relate the opposite.
Combining technical and fundamental analysis
Traders can combine technical and fundamental analysis by staying tapped into economic reports for opinion formation while using technical analysis to help enter and exit actual positions. For example, you can generate a bullish or bearish idea around a market based on inflation and then wait to buy or sell at prices determined to be advantageous by the positioning of moving averages.
How to trade forex using analysis
- Choose the forex market you’d like to trade
- Open an account to get started, or practice on a demo account
- Choose your forex trading platform
- Open, monitor, and close positions
Trading forex using technical and fundamental analysis requires an account with a forex provider like tastyfx and a strategy. Most strategies applicable to trading in other markets can be used to trade forex as well, including technical and fundamental analysis. You can help develop your forex trading strategies using resources like tastyfx’s YouTube channel.
Once your strategy is developed, you can follow the above steps to opening an account and getting started trading forex.
Your profit or loss is calculated according to your full position size. Leverage will magnify both your profits and losses. It’s important to manage your risks carefully as losses can exceed your deposit. Ensure you understand the risks and benefits associated with trading leveraged products before you start trading with them. Trade using money you’re comfortable losing.
This information has been prepared by tastyfx, a trading name of tastyfx LLC. This material does not contain a record of our trading prices, or an offer of, or solicitation for, a transaction in any financial instrument. You should not treat any opinion expressed in this material as a specific inducement to make any investment or follow any strategy, but only as an expression of opinion. This material does not consider your investment objectives, financial situation or needs and is not intended as recommendations appropriate for you. No representation or warranty is given as to the accuracy or completeness of the above information. tastyfx accepts no responsibility for any use that may be made of these comments and for any consequences that result. See our Summary Conflicts Policy, available on our website.